ICICI Bank 2003 Annual Report Download - page 61
Download and view the complete annual report
Please find page 61 of the 2003 ICICI Bank annual report below. You can navigate through the pages in the report by either clicking on the pages listed below, or by using the keyword search tool below to find specific information within the annual report.-
 1
1 -
2
-
3
-
4
-
5
-
6
-
7
-
8
-
9
-
10
-
11
-
12
-
13
-
14
-
15
-
16
-
17
-
18
-
19
-
20
-
21
-
22
-
23
-
24
-
25
-
26
-
27
-
28
-
29
-
30
-
31
-
32
-
33
-
34
-
35
-
36
-
37
-
38
-
39
-
40
-
41
-
42
-
43
-
44
-
45
-
46
-
47
-
48
-
49
-
50
-
 51
51 -
 52
52 -
 53
53 -
 54
54 -
 55
55 -
 56
56 -
 57
57 -
 58
58 -
 59
59 -
 60
60 -
 61
61 -
 62
62 -
 63
63 -
 64
64 -
 65
65 -
 66
66 -
 67
67 -
 68
68 -
 69
69 -
 70
70 -
 71
71 -
72
-
73
-
74
-
75
-
76
-
77
-
78
-
79
-
80
-
81
-
82
-
83
-
84
-
85
-
86
-
87
-
88
-
89
-
90
-
91
-
92
-
93
-
94
-
95
-
96
-
97
-
98
-
99
-
100
-
101
-
102
-
103
-
104
-
105
-
106
-
107
-
108
-
109
-
110
-
111
-
112
-
113
-
114
-
115
-
116
-
117
-
118
-
119
-
120
-
121
-
122
-
123
-
124
-
125
-
126
-
127
-
128
-
129
-
130
-
131
-
132
-
133
-
134
-
135
-
136
-
137
-
138
-
139
-
140
-
141
-
142
-
143
-
144
-
145
-
146
-
147
-
148
-
149
-
150
-
151
-
152
-
153
-
154
-
155
-
156
-
157
-
158
-
159
-
160
-
161
-
162
-
163
-
164
 |
 |

Management’s Discussion & Analysis
59
a. ICICI Bank’s net worth as per US GAAP on March 31, 2003 was Rs. 92.21 billion, which was significantly
higher than the consolidated net worth as per Indian GAAP of Rs. 66.72 billion.
b. Under Indian GAAP, capital gains of Rs. 11.91 billion on the sale of shares of ICICI Bank and provisions
of Rs. 17.91 billion were both accounted for in the profit and loss account. US GAAP requires the capital
gains to be directly added to the net worth without being routed through the profit and loss account
while provisions of Rs. 22.26 billion were accounted for in the profit and loss account under US GAAP.
Thus, while the US GAAP profit and loss account does not include the capital gains, it includes the full
negative impact of the provisions.
c. Under US GAAP, ICICI is deemed to have acquired ICICI Bank and therefore ICICI Bank’s assets were
fair-valued while accounting for the merger. Thus, ICICI Bank’s investment portfolio on the date of the
merger was marked-to-market with a positive impact on the value of the portfolio and the net worth.
As a result, treasury gains of Rs. 4.47 billion realized during the year and recognized as treasury income
under Indian GAAP were lower by Rs. 2.15 billion as this amount was already recognized in the opening
net worth under US GAAP.
The technical accounting differences in respect of capital gains and treasury gains alone have a negative
impact of Rs. 14.06 billion on the US GAAP profit and loss account, although the positive impact is accounted
for in the net worth.
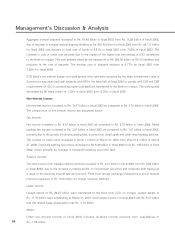
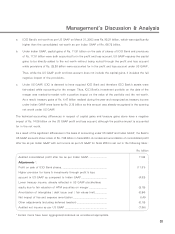
As a result of the significant differences in the basis of accounting under US GAAP and Indian GAAP, the Bank’s
US GAAP accounts show a loss of Rs. 7.98 billion in fiscal 2003. A condensed reconciliation of consolidated profit
after tax as per Indian GAAP with net income as per US GAAP for fiscal 2003 is set out in the following table :
Rs. billion
Audited consolidated profit after tax as per Indian GAAP ......................... 11.52
Adjustments 1:
Profit on sale of ICICI Bank shares .............................................................. (11.91)
Higher provision for loans & investments through profit & loss
account in US GAAP as compared to Indian GAAP ................................... (4.93)
Lower treasury income, already reflected in US GAAP stockholders
equity due to fair valuation of HTM securities on merger ........................ (2.15)
Amortization of intangibles / debt issue cost / fair values (net) ................ (0.84)
Net impact of fee and expense amortization .............................................. 0.49
Other adjustments (including deferred taxation) ......................................... (0.16)
Audited net income as per US GAAP ......................................................... (7.98)
1 Certain items have been aggregated/combined as considered appropriate.