ICICI Bank 2003 Annual Report Download - page 58
Download and view the complete annual report
Please find page 58 of the 2003 ICICI Bank annual report below. You can navigate through the pages in the report by either clicking on the pages listed below, or by using the keyword search tool below to find specific information within the annual report.-
 1
1 -
2
-
3
-
4
-
5
-
6
-
7
-
8
-
9
-
10
-
11
-
12
-
13
-
14
-
15
-
16
-
17
-
18
-
19
-
20
-
21
-
22
-
23
-
24
-
25
-
26
-
27
-
28
-
29
-
30
-
31
-
32
-
33
-
34
-
35
-
36
-
37
-
38
-
39
-
40
-
41
-
42
-
43
-
44
-
45
-
46
-
47
-
 48
48 -
 49
49 -
 50
50 -
 51
51 -
 52
52 -
 53
53 -
 54
54 -
 55
55 -
 56
56 -
 57
57 -
 58
58 -
 59
59 -
 60
60 -
 61
61 -
 62
62 -
 63
63 -
 64
64 -
 65
65 -
 66
66 -
 67
67 -
 68
68 -
69
-
70
-
71
-
72
-
73
-
74
-
75
-
76
-
77
-
78
-
79
-
80
-
81
-
82
-
83
-
84
-
85
-
86
-
87
-
88
-
89
-
90
-
91
-
92
-
93
-
94
-
95
-
96
-
97
-
98
-
99
-
100
-
101
-
102
-
103
-
104
-
105
-
106
-
107
-
108
-
109
-
110
-
111
-
112
-
113
-
114
-
115
-
116
-
117
-
118
-
119
-
120
-
121
-
122
-
123
-
124
-
125
-
126
-
127
-
128
-
129
-
130
-
131
-
132
-
133
-
134
-
135
-
136
-
137
-
138
-
139
-
140
-
141
-
142
-
143
-
144
-
145
-
146
-
147
-
148
-
149
-
150
-
151
-
152
-
153
-
154
-
155
-
156
-
157
-
158
-
159
-
160
-
161
-
162
-
163
-
164
 |
 |

Management’s Discussion & Analysis
56
ICICI Bank has adopted a conservative general provisioning policy for its standard asset portfolio. The Bank
had already created fair valuation provisions against the corporate and project finance portfolio acquired from
ICICI in the merger. While Reserve Bank of India guidelines require only a 0.25% general provision against
standard assets, ICICI Bank makes additional general provisions against standard assets having regard to
overall portfolio quality, asset growth, economic conditions and other risk factors. During the year, ICICI Bank
also made additional/accelerated provisions against loans and other assets, primarily relating to ICICI’s portfolio.
ICICI Bank made aggregate provisions and write-offs of Rs. 17.91 billion, net of write-backs, in fiscal 2003.
Income-Tax Expense
On account of deferred tax asset arising out of provisions made in fiscal 2003 and utilisation of fair value
provisions against ICICI’s portfolio created at the time of the merger and after taking into account the tax charge
for the period, there was a net credit of Rs. 4.26 billion on account of Income tax. Deferred-tax asset has been
accounted for in accordance with the provisions of Accounting Standard 22 issued by the Institute of Chartered
Accountants of India, which requires recognition of deferred-tax assets and liabilities for the expected future
tax consequences of the events that have been included in the financial statements or tax returns. Charge to
profit for tax expense in fiscal 2002 was Rs. 0.32 billion after deferred-tax credit of Rs. 0.90 billion.
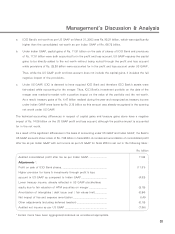
FINANCIAL CONDITION
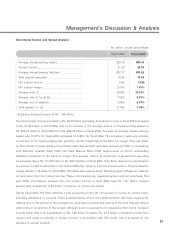
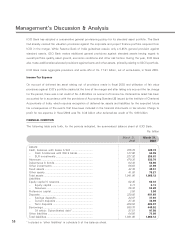
The following table sets forth, for the periods indicated, the summarised balance sheet of ICICI Bank.
Rs. billion
March 31, March 31,
2002 2003
Assets:
Cash, balances with banks & SLR ............................. 355.78 320.72
– Cash & balances with RBI & banks .................... 127.86 64.89
– SLR investments .................................................. 227.92 255.83
Advances ...................................................................... 470.35 532.79
Debentures & bonds .................................................... 64.36 56.90
Other investments ....................................................... 66.63 41.89
Fixed assets ................................................................. 42.39 40.61
Other assets ................................................................ 41.55 75.21
Total assets .................................................................. 1,041.06 1,068.12
Liabilities:
Equity capital & reserves ............................................. 62.45 69.33
– Equity capital ....................................................... 6.13 6.13
– Reserves ............................................................... 56.32 63.20
Preference capital ........................................................ 3.50 3.50
Deposits ....................................................................... 320.85 481.69
– Savings deposits .................................................. 24.97 37.93
– Current deposits .................................................. 27.36 36.89
– Term deposits ...................................................... 268.52 406.87
Borrowings ................................................................... 589.70 440.52
Of which: Subordinated debt1............................ 97.51 97.50
Other liabilities ............................................................. 64.56 73.08
Total liabilities ............................................................... 1,041.06 1,068.12
1 Included in ‘other liabilities’ in schedule 5 of the balance sheet.