ICICI Bank 2003 Annual Report Download - page 121
Download and view the complete annual report
Please find page 121 of the 2003 ICICI Bank annual report below. You can navigate through the pages in the report by either clicking on the pages listed below, or by using the keyword search tool below to find specific information within the annual report.-
 1
1 -
2
-
3
-
4
-
5
-
6
-
7
-
8
-
9
-
10
-
11
-
12
-
13
-
14
-
15
-
16
-
17
-
18
-
19
-
20
-
21
-
22
-
23
-
24
-
25
-
26
-
27
-
28
-
29
-
30
-
31
-
32
-
33
-
34
-
35
-
36
-
37
-
38
-
39
-
40
-
41
-
42
-
43
-
44
-
45
-
46
-
47
-
48
-
49
-
50
-
51
-
52
-
53
-
54
-
55
-
56
-
57
-
58
-
59
-
60
-
61
-
62
-
63
-
64
-
65
-
66
-
67
-
68
-
69
-
70
-
71
-
72
-
73
-
74
-
75
-
76
-
77
-
78
-
79
-
80
-
81
-
82
-
83
-
84
-
85
-
86
-
87
-
88
-
89
-
90
-
91
-
92
-
93
-
94
-
95
-
96
-
97
-
98
-
99
-
100
-
101
-
102
-
103
-
104
-
105
-
106
-
107
-
108
-
109
-
110
-
 111
111 -
 112
112 -
 113
113 -
 114
114 -
 115
115 -
 116
116 -
 117
117 -
 118
118 -
 119
119 -
 120
120 -
 121
121 -
 122
122 -
 123
123 -
 124
124 -
 125
125 -
 126
126 -
 127
127 -
 128
128 -
 129
129 -
 130
130 -
 131
131 -
132
-
133
-
134
-
135
-
136
-
137
-
138
-
139
-
140
-
141
-
142
-
143
-
144
-
145
-
146
-
147
-
148
-
149
-
150
-
151
-
152
-
153
-
154
-
155
-
156
-
157
-
158
-
159
-
160
-
161
-
162
-
163
-
164
 |
 |

F57
Rs. Rs. Rs. USD
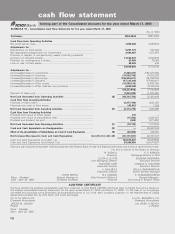
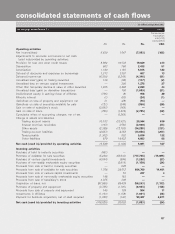
Operating activities
Net income/(loss) 6,630 1,547 (7,983) (168)
Adjustments to reconcile net income to net cash
(used in)/provided by operating activities:
Provision for loan and other credit losses 9,892 10,532 19,649 413
Depreciation 663 786 2,438 51
Amortization 1,180 1,193 5,815 122
Deferral of discounts and expenses on borrowings 1,213 1,307 607 13
Deferred income tax (4,339) (3,245) (4,348) (91)
Unrealised loss/ (gain) on trading securities 136 (80) (117) (2)
Unrealised loss on venture capital investments — 300 1,278 27
Other than temporary decline in value of other securities 1,835 3,480 2,098 44
Unrealised loss/ (gain) on derivative transactions — 190 (1,009) (21)
Undistributed equity in earning/ (loss) of affiliates (735) (9) 958 20
Minority interest (1) (83) (24) (1)
(Gain)/loss on sale of property and equipment, net 31 (29) (16) —
(Gain)/loss on sale of securities available for sale (121) (349) (956) (20)
Gain on sale of subsidiary’s stock (2,507) (165) ——
Gain on sale of loans (705) (1,979) (2,795) (59)
Cumulative effect of accounting changes, net of tax — (1,265) ——
Change in assets and liabilities
Trading account assets 10,153 (23,421) 29,944 630
Interest and fees receivable (107) 3,583 (2,990) (63)
Other assets (2,389) (12,783) (34,295) (721)
Trading account liabilities (4,857) 4,352 (13,656) (287)
Taxes payable (1,302) 552 5,830 122
Other liabilities 879 14,422 4,663 98
Net cash (used in)/provided by operating activities 15,549 (1,164) 5,091 107
Investing activities
Purchase of held to maturity securities (861) — ——
Purchase of available for sale securities (5,230) (68,043) (717,765) (15,095)
Purchase of venture capital investments (4,094) (504) (1,268) (27)
Purchase of non-readily marketable equity securities — (2,015) (1,150) (24)
Proceeds from sale of held to maturity securities — 640 ——
Proceeds from sale of available for sale securities 1,756 28,512 684,769 14,401
Proceeds from sale of venture capital investments —53207 4
Proceeds from sale of non-readily marketable equity securities 148 183 ——
Proceeds from sale of subsidiary’s stock 4,075 302 ——
Origination of loans, net (97,868) 69,439 (56,243) (1,183)
Purchase of property and equipment (3,785) (1,701) (6,943) (146)
Proceeds from sale of property and equipment 145 128 504 11
Investments in affiliates (1,161) (1,159) (1,691) (36)
Payment for business acquisition, net of cash acquired (1,950) (143) 98,487 2,071
Net cash (used in)/provided by investing activities (108,825) 25,692 (1,093) (24)
consolidated statements of cash flows
for the year ended March 31,
1999 2000
2001 2001
(in millions, except share data)
Convenience
translation
into USD
(unaudited)
for the year ended March 31,
2001 2002
(1)
2003 2003
(1)