ICICI Bank 2003 Annual Report Download - page 60
Download and view the complete annual report
Please find page 60 of the 2003 ICICI Bank annual report below. You can navigate through the pages in the report by either clicking on the pages listed below, or by using the keyword search tool below to find specific information within the annual report.-
 1
1 -
2
-
3
-
4
-
5
-
6
-
7
-
8
-
9
-
10
-
11
-
12
-
13
-
14
-
15
-
16
-
17
-
18
-
19
-
20
-
21
-
22
-
23
-
24
-
25
-
26
-
27
-
28
-
29
-
30
-
31
-
32
-
33
-
34
-
35
-
36
-
37
-
38
-
39
-
40
-
41
-
42
-
43
-
44
-
45
-
46
-
47
-
48
-
49
-
 50
50 -
 51
51 -
 52
52 -
 53
53 -
 54
54 -
 55
55 -
 56
56 -
 57
57 -
 58
58 -
 59
59 -
 60
60 -
 61
61 -
 62
62 -
 63
63 -
 64
64 -
 65
65 -
 66
66 -
 67
67 -
 68
68 -
 69
69 -
 70
70 -
71
-
72
-
73
-
74
-
75
-
76
-
77
-
78
-
79
-
80
-
81
-
82
-
83
-
84
-
85
-
86
-
87
-
88
-
89
-
90
-
91
-
92
-
93
-
94
-
95
-
96
-
97
-
98
-
99
-
100
-
101
-
102
-
103
-
104
-
105
-
106
-
107
-
108
-
109
-
110
-
111
-
112
-
113
-
114
-
115
-
116
-
117
-
118
-
119
-
120
-
121
-
122
-
123
-
124
-
125
-
126
-
127
-
128
-
129
-
130
-
131
-
132
-
133
-
134
-
135
-
136
-
137
-
138
-
139
-
140
-
141
-
142
-
143
-
144
-
145
-
146
-
147
-
148
-
149
-
150
-
151
-
152
-
153
-
154
-
155
-
156
-
157
-
158
-
159
-
160
-
161
-
162
-
163
-
164
 |
 |

Management’s Discussion & Analysis
58
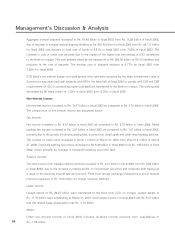
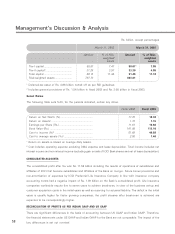
Rs. billion, except percentages
March 31, 2002 March 31, 2003
Amount % of Risk- Amount % of Risk-
weighted weighted
assets assets
Tier-I capital ...................................... 58.87 7.47 58.0717.05
Tier-II capital2.................................... 31.25 3.97 33.39 4.05
Total capital ...................................... 90.12 11.44 91.46 11.10
Risk-weighted assets ....................... 787.73 823.81
1 Deferred-tax asset of Rs. 4.88 billion netted off as per RBI guidelines.
2 Includes general provisions of Rs. 1.54 billion in fiscal 2002 and Rs. 3.08 billion in fiscal 2003.
Select Ratios
The following table sets forth, for the periods indicated, certain key ratios.
Fiscal 2002 Fiscal 2003
Return on Net Worth (%)............................................ 17.75 18.30
Return on Assets1........................................................ 1.10 1.15
Earnings per Share (Rs.) ............................................. 11.61 19.68
Book Value (Rs.) .......................................................... 101.88 113.10
Cost to income (%)2................................................... 51.69 49.88
Cost to average assets (%)2....................................... 2.55 1.46
1 Return on assets is based on average daily assets.
2 Cost includes operating expense excluding DMA expense and lease depreciation. Total income includes net
interest income and non-interest income (excluding gain on sale of ICICI Bank shares and net of lease depreciation).
CONSOLIDATED ACCOUNTS
The consolidated profit after tax was Rs. 11.52 billion including the results of operations of subsidiaries and
affiliates of ICICI that became subsidiaries and affiliates of the Bank on merger. Future bonus provisions and
non-amortisation of expenses by ICICI Prudential Life Insurance Company in line with insurance company
accounting norms had a negative impact of Rs. 1.09 billion on the Bank’s consolidated profit. Life insurance
companies worldwide require five to seven years to achieve break-even, in view of the business set-up and
customer acquisition costs in the initial years as well as reserving for actuarial liability. The deficit in the initial
years is usually higher for faster growing companies; the profit streams after break-even is achieved are
expected to be correspondingly higher.
RECONCILIATION OF PROFITS AS PER INDIAN GAAP AND US GAAP
There are significant differences in the basis of accounting between US GAAP and Indian GAAP. Therefore,
the financial statements under US GAAP and Indian GAAP for the Bank are not comparable. The impact of the
key differences is set out overleaf: