ICICI Bank 2003 Annual Report Download - page 62
Download and view the complete annual report
Please find page 62 of the 2003 ICICI Bank annual report below. You can navigate through the pages in the report by either clicking on the pages listed below, or by using the keyword search tool below to find specific information within the annual report.-
 1
1 -
2
-
3
-
4
-
5
-
6
-
7
-
8
-
9
-
10
-
11
-
12
-
13
-
14
-
15
-
16
-
17
-
18
-
19
-
20
-
21
-
22
-
23
-
24
-
25
-
26
-
27
-
28
-
29
-
30
-
31
-
32
-
33
-
34
-
35
-
36
-
37
-
38
-
39
-
40
-
41
-
42
-
43
-
44
-
45
-
46
-
47
-
48
-
49
-
50
-
51
-
 52
52 -
 53
53 -
 54
54 -
 55
55 -
 56
56 -
 57
57 -
 58
58 -
 59
59 -
 60
60 -
 61
61 -
 62
62 -
 63
63 -
 64
64 -
 65
65 -
 66
66 -
 67
67 -
 68
68 -
 69
69 -
 70
70 -
 71
71 -
 72
72 -
73
-
74
-
75
-
76
-
77
-
78
-
79
-
80
-
81
-
82
-
83
-
84
-
85
-
86
-
87
-
88
-
89
-
90
-
91
-
92
-
93
-
94
-
95
-
96
-
97
-
98
-
99
-
100
-
101
-
102
-
103
-
104
-
105
-
106
-
107
-
108
-
109
-
110
-
111
-
112
-
113
-
114
-
115
-
116
-
117
-
118
-
119
-
120
-
121
-
122
-
123
-
124
-
125
-
126
-
127
-
128
-
129
-
130
-
131
-
132
-
133
-
134
-
135
-
136
-
137
-
138
-
139
-
140
-
141
-
142
-
143
-
144
-
145
-
146
-
147
-
148
-
149
-
150
-
151
-
152
-
153
-
154
-
155
-
156
-
157
-
158
-
159
-
160
-
161
-
162
-
163
-
164
 |
 |

Management’s Discussion & Analysis
60
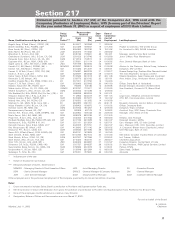
ASSET QUALITY AND COMPOSITION
Loan Portfolio
ICICI Bank follows a strategy of building a diversified and de-risked asset portfolio and limiting or correcting
concentrations in particular sectors.
ICICI Bank limits its exposure to any particular industry to 15.0% of its total exposure. The following table sets
forth ICICI Bank’s industry-wise exposure at March 31, 2002 and at March 31, 2003.
Rs. billion, except percentages
March 31, March 31,
2002 2003
Industry % of total % of total Exposure1
Retail .................................................................. 7.9 22.8 191.32
Power ................................................................ 11.2 10.1 85.01
Iron & steel ........................................................ 11.1 9.6 80.42
Services ............................................................. 9.3 8.5 71.61
Telecommunications ......................................... 5.1 5.2 44.03
Textiles ............................................................... 6.2 4.9 41.06
Crude petroleum & refining .............................. 5.4 4.1 34.11
Engineering ....................................................... 3.5 3.4 28.93
Electronics ......................................................... 2.9 2.7 22.41
Metal & metal products ................................... 2.5 2.4 20.04
Cement .............................................................. 2.8 2.3 19.31
Petrochemicals .................................................. 1.2 2.1 17.83
Roads, ports & railways ................................... 1.4 1.9 16.28
Chemicals .......................................................... 2.5 1.7 13.96
Automobiles ...................................................... 2.3 1.6 13.50
Fertilisers ........................................................... 1.3 1.6 13.08
Paper & paper products ................................... 2.2 1.5 12.56
Food processing ............................................... 1.4 1.4 11.83
Man-made fibres ............................................... 1.5 1.4 11.52
Hotels ................................................................ 1.6 1.2 10.10
Sugar ................................................................. 1.1 1.0 8.60
Plastics .............................................................. 1.4 1.0 8.57
Shipping ............................................................ 1.0 0.8 6.98
Non-banking finance companies ..................... 1.3 0.7 5.92
Drugs & pharmaceuticals ................................. 1.2 0.7 5.53
Rubber & rubber products ............................... 0.5 0.3 2.91
Mining ............................................................... 1.1 0.3 2.62
Other infrastructure .......................................... 0.3 0.2 1.87
Miscellaneous ................................................... 8.8 4.6 38.68
Total ................................................................... 100.0 100.0 840.59
1 Includes principal outstanding, charges and non-fund-based exposures at 50%.