ICICI Bank 2003 Annual Report Download - page 135
Download and view the complete annual report
Please find page 135 of the 2003 ICICI Bank annual report below. You can navigate through the pages in the report by either clicking on the pages listed below, or by using the keyword search tool below to find specific information within the annual report.-
 1
1 -
2
-
3
-
4
-
5
-
6
-
7
-
8
-
9
-
10
-
11
-
12
-
13
-
14
-
15
-
16
-
17
-
18
-
19
-
20
-
21
-
22
-
23
-
24
-
25
-
26
-
27
-
28
-
29
-
30
-
31
-
32
-
33
-
34
-
35
-
36
-
37
-
38
-
39
-
40
-
41
-
42
-
43
-
44
-
45
-
46
-
47
-
48
-
49
-
50
-
51
-
52
-
53
-
54
-
55
-
56
-
57
-
58
-
59
-
60
-
61
-
62
-
63
-
64
-
65
-
66
-
67
-
68
-
69
-
70
-
71
-
72
-
73
-
74
-
75
-
76
-
77
-
78
-
79
-
80
-
81
-
82
-
83
-
84
-
85
-
86
-
87
-
88
-
89
-
90
-
91
-
92
-
93
-
94
-
95
-
96
-
97
-
98
-
99
-
100
-
101
-
102
-
103
-
104
-
105
-
106
-
107
-
108
-
109
-
110
-
111
-
112
-
113
-
114
-
115
-
116
-
117
-
118
-
119
-
120
-
121
-
122
-
123
-
124
-
 125
125 -
 126
126 -
 127
127 -
 128
128 -
 129
129 -
 130
130 -
 131
131 -
 132
132 -
 133
133 -
 134
134 -
 135
135 -
 136
136 -
 137
137 -
 138
138 -
 139
139 -
 140
140 -
 141
141 -
 142
142 -
 143
143 -
 144
144 -
 145
145 -
146
-
147
-
148
-
149
-
150
-
151
-
152
-
153
-
154
-
155
-
156
-
157
-
158
-
159
-
160
-
161
-
162
-
163
-
164
 |
 |

F71
Continued
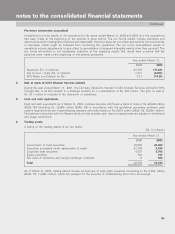
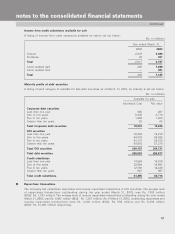
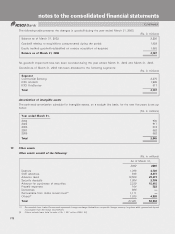
Income from credit substitutes available for sale
A listing of income from credit substitutes available for sale is set out below:
(Rs. in millions)
Year ended March 31,
2002 2003
Interest 2,872 8,406
Dividends 45 381
Total 2,917 8,787
Gross realized gain 282 1,200
Gross realized loss —(75)
Total 282 1,125
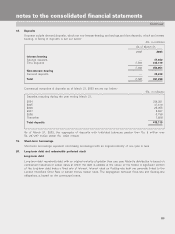
Maturity profile of debt securities
A listing of each category of available for sale debt securities as of March31, 2003, by maturity is set out below:
(Rs. in millions)
Available for sale
Amortized Cost Fair value
Corporate debt securities
Less than one year 285 267
One to five years 8,436 8,719
Five to ten years 1,862 1,900
Greater than ten years 53 60
Total Corporate debt securities 10,636 10,946
GOI securities
Less than one year 76,238 76,216
One to five years 54,976 55,922
Five to ten years 54,170 54,614
Greater than ten years 54,803 57,379
Total GOI securities 240,187 244,131
Total debt securities 250,893 255,077
Credit substitutes
Less than one year 14,584 14,618
One to five years 32,984 34,683
Five to ten years 12,760 12,448
Greater than ten years 967 967
Total credit substitutes 61,295 62,716
8.8.
8.8.
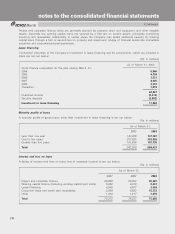
8. Repurchase transactions
The Company has undertaken repurchase and reverse repurchase transactions in GOI securities. The average level
of repurchase transactions outstanding during the year ended March 31, 2003, was Rs. 7002million
(2002: Rs. 1,743million). The average level of reverse repurchase transactions outstanding during the year ended
March 31, 2003, was Rs. 4,483million (2002:Rs. 1,347million). As of March 31, 2003, outstanding repurchase and
reverse repurchase transactions were Rs. 3,000 million (2002: Rs. 595 million) and Rs. 5,399 million
(2002: Rs. 21,399million) respectively.
notes to the consolidated financial statements