ICICI Bank 2003 Annual Report Download - page 122
Download and view the complete annual report
Please find page 122 of the 2003 ICICI Bank annual report below. You can navigate through the pages in the report by either clicking on the pages listed below, or by using the keyword search tool below to find specific information within the annual report.-
 1
1 -
2
-
3
-
4
-
5
-
6
-
7
-
8
-
9
-
10
-
11
-
12
-
13
-
14
-
15
-
16
-
17
-
18
-
19
-
20
-
21
-
22
-
23
-
24
-
25
-
26
-
27
-
28
-
29
-
30
-
31
-
32
-
33
-
34
-
35
-
36
-
37
-
38
-
39
-
40
-
41
-
42
-
43
-
44
-
45
-
46
-
47
-
48
-
49
-
50
-
51
-
52
-
53
-
54
-
55
-
56
-
57
-
58
-
59
-
60
-
61
-
62
-
63
-
64
-
65
-
66
-
67
-
68
-
69
-
70
-
71
-
72
-
73
-
74
-
75
-
76
-
77
-
78
-
79
-
80
-
81
-
82
-
83
-
84
-
85
-
86
-
87
-
88
-
89
-
90
-
91
-
92
-
93
-
94
-
95
-
96
-
97
-
98
-
99
-
100
-
101
-
102
-
103
-
104
-
105
-
106
-
107
-
108
-
109
-
110
-
111
-
 112
112 -
 113
113 -
 114
114 -
 115
115 -
 116
116 -
 117
117 -
 118
118 -
 119
119 -
 120
120 -
 121
121 -
 122
122 -
 123
123 -
 124
124 -
 125
125 -
 126
126 -
 127
127 -
 128
128 -
 129
129 -
 130
130 -
 131
131 -
 132
132 -
133
-
134
-
135
-
136
-
137
-
138
-
139
-
140
-
141
-
142
-
143
-
144
-
145
-
146
-
147
-
148
-
149
-
150
-
151
-
152
-
153
-
154
-
155
-
156
-
157
-
158
-
159
-
160
-
161
-
162
-
163
-
164
 |
 |

F58
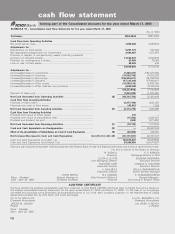
Rs. Rs. Rs. USD
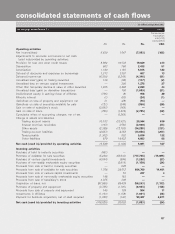
Financing activities
Increase in deposits, net 8,050 1,308 158,290 3,329
Proceeds/ Repayment from short-term borrowings, net 21,204 (28,852) (30,118) (633)
Proceeds from other borrowings — 5,787 ——
Proceeds from issuances of long-term debt 182,015 158,905 10,631 224
Repayment of long-term debt (112,047) (142,019) (124,979) (2,628)
Redemption of redeemable preferred stock (9,577) — ——
Proceeds from issuance of common stock 142 — 13,155 277
Proceeds from issuance of common stock by subsidiary 465 390 ——
Cash dividends paid (775) (9,514) ——
Net cash provided by/(used in) financing activities 89,477 (13,995) 26,979 569
Effect of de-consolidation of subsidiary on
cash and cash equivalents (36,361) — ——
Effect of exchange rate on cash and cash equivalents (14) (14) ——
Net increase/(decrease) in cash and cash equivalents (40,174) 10,519 30,977 652
Cash and cash equivalents at the beginning of the year 71,131 30,957 41,476 872
Cash and cash equivalents at the end of the year 30,957 41,476 72,453 1,524
Supplementary information:
Cash paid for:
Interest 57,144 66,587 86,143 1,812
Taxes 2,919 4,505 1,027 22
Non-cash items:
Foreclosed assets 2,024 1,188 673 14
Conversion of loan to equity shares 1,982 1,586 4,495 95
Transfer of securities from held to maturity
category to available for sale category — 866 ——
Change in unrealized gain/(loss) on
securities available for sale, net (1,674) 3,283 5,205 109
Acquisitions
Fair value of net assets acquired, excluding
cash and cash equivalents ——(37,948) 798
Shares issued — — 118,965,731 —
Treasury stock ——8,204 173
See accompanying notes to the consolidated financial statements.
(1) Restated for reverse acquisition and adoption of SFAS No. 147
Convenience
translation
into USD
(unaudited)
for the year ended March 31,
2001 2002
(1)
2003 2003
(1)
consolidated statements of cash flows
(Contd.)
(in millions, except share data)