ICICI Bank 2003 Annual Report Download - page 148
Download and view the complete annual report
Please find page 148 of the 2003 ICICI Bank annual report below. You can navigate through the pages in the report by either clicking on the pages listed below, or by using the keyword search tool below to find specific information within the annual report.-
 1
1 -
2
-
3
-
4
-
5
-
6
-
7
-
8
-
9
-
10
-
11
-
12
-
13
-
14
-
15
-
16
-
17
-
18
-
19
-
20
-
21
-
22
-
23
-
24
-
25
-
26
-
27
-
28
-
29
-
30
-
31
-
32
-
33
-
34
-
35
-
36
-
37
-
38
-
39
-
40
-
41
-
42
-
43
-
44
-
45
-
46
-
47
-
48
-
49
-
50
-
51
-
52
-
53
-
54
-
55
-
56
-
57
-
58
-
59
-
60
-
61
-
62
-
63
-
64
-
65
-
66
-
67
-
68
-
69
-
70
-
71
-
72
-
73
-
74
-
75
-
76
-
77
-
78
-
79
-
80
-
81
-
82
-
83
-
84
-
85
-
86
-
87
-
88
-
89
-
90
-
91
-
92
-
93
-
94
-
95
-
96
-
97
-
98
-
99
-
100
-
101
-
102
-
103
-
104
-
105
-
106
-
107
-
108
-
109
-
110
-
111
-
112
-
113
-
114
-
115
-
116
-
117
-
118
-
119
-
120
-
121
-
122
-
123
-
124
-
125
-
126
-
127
-
128
-
129
-
130
-
131
-
132
-
133
-
134
-
135
-
136
-
137
-
 138
138 -
 139
139 -
 140
140 -
 141
141 -
 142
142 -
 143
143 -
 144
144 -
 145
145 -
 146
146 -
 147
147 -
 148
148 -
 149
149 -
 150
150 -
 151
151 -
 152
152 -
 153
153 -
 154
154 -
 155
155 -
 156
156 -
 157
157 -
 158
158 -
159
-
160
-
161
-
162
-
163
-
164
 |
 |

F84
Continued
notes to the consolidated financial statements
Others consist of various operating segments that do not meet the requirements to be reported as on individual
reportable segment as defined in SFAS No. 131.
The CODM evaluates the Company’s performance and allocates resources based on performance indicators
(components of profit and loss) of each of the segments. Further, the CODM specifically reviews assets of the
personal financial services division, which is a part of commercial banking segment.
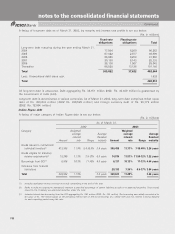
The profit and loss of reportable segments is set out below:
(Rs. in millions)
Commercial Banking Investment Banking
Year ended March 31, Year ended March 31,
2001 2002 2003 2001 2002 2003
Income from external customers
Interest income 85,169 91,445 76,498 7,328 8,239 21,595
Non - interest income 8,401 9,747 4,771 1,824 1,826 6,792
Income from other operating segments
Interest income 1,413 3,796 8,533 8,823 11,007 189
Non - interest income 658 1,040 384 236 219 251
Total income 95,641 106,028 90,186 18,211 21,291 28,827
Interest expense 72,111 81,867 69,462 14,327 17,454 23,916
Depreciation 948 1,244 2,008 67 89 231
Provision for loan losses 10,962 11,458 19,645 13 8 4
Other expenses 6,731 10,321 10,343 1,240 1,781 2,921
Income/(loss) before taxes 4,889 1,138 (11,272) 2,564 1,959 1,755
Income tax (expense)/benefit (347) (728) 3,420 24 (659) (529)
Cumulative effect of accounting changes, net of tax — 1,281 ————
Net income/(loss) 4,542 1,691 (7,852) 2,588 1,300 1,226
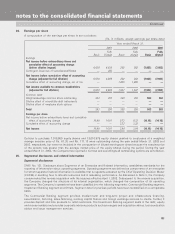
A listing of certain assets of reportable segments is set out below:
(Rs. in millions)
Commercial Investment Eliminations
Banking Banking Others of the acquiree Total
As of March 31, 2002 2003 2002 2003 2002 2003 2002 2003 2002 2003
Property and
equipment 13,157 16,048 2,152 2,754 2,099 2,413 (4,831) —12,577 21,215
Investment in
equity affiliates 15 ——252 1,867 2,363 ——1,882 2,615
Inter segment transactions are generally based on transfer pricing measures as determined by management. Income,
expenses, assets and liabilities are either specifically identifiable with individual segments or have been allocated to
segments on a systematic basis. Corporate overheads and assets have also been allocated to segments on a
systematic basis.