ICICI Bank 2003 Annual Report Download - page 63
Download and view the complete annual report
Please find page 63 of the 2003 ICICI Bank annual report below. You can navigate through the pages in the report by either clicking on the pages listed below, or by using the keyword search tool below to find specific information within the annual report.-
 1
1 -
2
-
3
-
4
-
5
-
6
-
7
-
8
-
9
-
10
-
11
-
12
-
13
-
14
-
15
-
16
-
17
-
18
-
19
-
20
-
21
-
22
-
23
-
24
-
25
-
26
-
27
-
28
-
29
-
30
-
31
-
32
-
33
-
34
-
35
-
36
-
37
-
38
-
39
-
40
-
41
-
42
-
43
-
44
-
45
-
46
-
47
-
48
-
49
-
50
-
51
-
52
-
 53
53 -
 54
54 -
 55
55 -
 56
56 -
 57
57 -
 58
58 -
 59
59 -
 60
60 -
 61
61 -
 62
62 -
 63
63 -
 64
64 -
 65
65 -
 66
66 -
 67
67 -
 68
68 -
 69
69 -
 70
70 -
 71
71 -
 72
72 -
 73
73 -
74
-
75
-
76
-
77
-
78
-
79
-
80
-
81
-
82
-
83
-
84
-
85
-
86
-
87
-
88
-
89
-
90
-
91
-
92
-
93
-
94
-
95
-
96
-
97
-
98
-
99
-
100
-
101
-
102
-
103
-
104
-
105
-
106
-
107
-
108
-
109
-
110
-
111
-
112
-
113
-
114
-
115
-
116
-
117
-
118
-
119
-
120
-
121
-
122
-
123
-
124
-
125
-
126
-
127
-
128
-
129
-
130
-
131
-
132
-
133
-
134
-
135
-
136
-
137
-
138
-
139
-
140
-
141
-
142
-
143
-
144
-
145
-
146
-
147
-
148
-
149
-
150
-
151
-
152
-
153
-
154
-
155
-
156
-
157
-
158
-
159
-
160
-
161
-
162
-
163
-
164
 |
 |

Management’s Discussion & Analysis
61
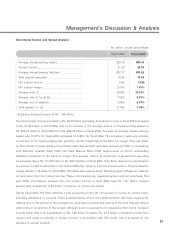
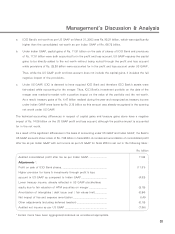
At March 31, 2003, the largest exposure was to retail finance, which constituted 22.8% of total exposure.
Other sectors that constituted a significant portion of exposure were power (10.1%), iron & steel (9.6%) and
services (8.5%).
As per RBI guidelines, the current exposure ceiling for a single borrower is 15% of total capital and for a group
of borrowers is 40% of total capital. However, in the case of financing for infrastructure projects, the limit for
a single borrower may be extended to 20% of total capital and for a group may be extended to 50% of total
capital. Total capital comprises Tier-I and Tier-II capital as defined for determining capital adequacy.
The largest borrower at March 31, 2003 accounted for approximately 2.4% of ICICI Bank’s total exposure and
22.3% of ICICI Bank’s total capital. The Bank has received RBI’s permission to exceed the exposure limit for
this borrower. The largest borrower group at March 31, 2003 accounted for approximately 4.8% of ICICI Bank’s
total exposure and 44.2% of ICICI Bank’s total capital which is within the prescribed limit taking into account
infrastructure financing. At March 31, 2003, ICICI Bank’s ten largest individual borrowers in aggregate accounted
for approximately 12.0% of its total exposure and its ten largest borrower groups in aggregate accounted for
approximately 23.1% of its total exposure.
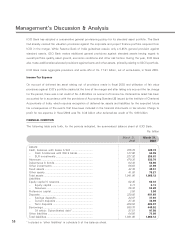
CLASSIFICATION OF LOAN ASSETS
All credit exposures are classified as per RBI guidelines into performing and non-performing assets. Further,
non-performing assets are classified into sub-standard, doubtful and loss assets. The RBI guidelines require
restructured assets to be separately disclosed.
The following table sets forth classification of net customer assets (net of write-offs and provisions) of ICICI
Bank at March 31, 2002 and at March 31, 2003.
Rs. billion
March 31, March 31,
2002 2003
Loss assets ................................................................................. ——
Doubtful assets ........................................................................... 21.80 19.90
Sub-standard assets ................................................................... 12.57 12.52
Of which, restructured sub-standard assets .................... 0.18 —
Less: general provisions held against non-performing assets 7.16 0.91
Standard assets .......................................................................... 548.05 609.00
Of which, restructured standard assets ........................... 46.98 89.43
Net customer assets .................................................................. 575.26 640.51
1 All loss assets have been written off or provided for.
2 Provisions of Rs. 0.91 billion are held as general provisions against non-performing assets at March 31, 2003.