ICICI Bank 2003 Annual Report Download - page 64
Download and view the complete annual report
Please find page 64 of the 2003 ICICI Bank annual report below. You can navigate through the pages in the report by either clicking on the pages listed below, or by using the keyword search tool below to find specific information within the annual report.-
 1
1 -
2
-
3
-
4
-
5
-
6
-
7
-
8
-
9
-
10
-
11
-
12
-
13
-
14
-
15
-
16
-
17
-
18
-
19
-
20
-
21
-
22
-
23
-
24
-
25
-
26
-
27
-
28
-
29
-
30
-
31
-
32
-
33
-
34
-
35
-
36
-
37
-
38
-
39
-
40
-
41
-
42
-
43
-
44
-
45
-
46
-
47
-
48
-
49
-
50
-
51
-
52
-
53
-
 54
54 -
 55
55 -
 56
56 -
 57
57 -
 58
58 -
 59
59 -
 60
60 -
 61
61 -
 62
62 -
 63
63 -
 64
64 -
 65
65 -
 66
66 -
 67
67 -
 68
68 -
 69
69 -
 70
70 -
 71
71 -
 72
72 -
 73
73 -
 74
74 -
75
-
76
-
77
-
78
-
79
-
80
-
81
-
82
-
83
-
84
-
85
-
86
-
87
-
88
-
89
-
90
-
91
-
92
-
93
-
94
-
95
-
96
-
97
-
98
-
99
-
100
-
101
-
102
-
103
-
104
-
105
-
106
-
107
-
108
-
109
-
110
-
111
-
112
-
113
-
114
-
115
-
116
-
117
-
118
-
119
-
120
-
121
-
122
-
123
-
124
-
125
-
126
-
127
-
128
-
129
-
130
-
131
-
132
-
133
-
134
-
135
-
136
-
137
-
138
-
139
-
140
-
141
-
142
-
143
-
144
-
145
-
146
-
147
-
148
-
149
-
150
-
151
-
152
-
153
-
154
-
155
-
156
-
157
-
158
-
159
-
160
-
161
-
162
-
163
-
164
 |
 |

Management’s Discussion & Analysis
62
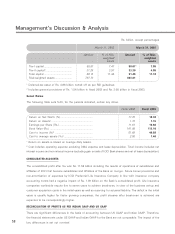
The ratio of net non-performing assets to net customer assets increased marginally to 4.9% at March 31, 2003
from 4.7% at March 31, 2002. At March 31, 2003, the gross non-performing assets (net of write-offs) were
Rs. 58.89 billion compared to Rs. 53.69 billion at March 31, 2002. Including write-offs against ICICI’s assets,
the gross non-performing loans at March 31, 2003 were Rs. 84.14 billion compared to Rs. 74.66 billion at
March 31, 2002. The coverage ratio (i.e. total provisions and write-offs made against non-performing assets
as a percentage of gross non-performing assets) at March 31, 2003 was 62.6% compared to 63.6% at March
31, 2002. In addition, ICICI Bank held a provision cover of 5.5% against its performing corporate portfolio.
At March 31, 2003, the net outstanding amount of the 20 largest non-performing cases where ICICI Bank has
decided to recall loans and enforce its security interest against the borrowers was Rs. 6.76 billion with no
individual borrower accounting for more than Rs. 1.19 billion. At March 31, 2003, the net outstanding amount
of the 20 largest non-performing cases, other than where ICICI Bank had decided to recall loans, aggregated
Rs. 10.36 billion, with no individual borrower accounting for more than Rs. 1.39 billion.
Classification of Non-Performing Loans by Industry
The following table sets forth the classification of net non-performing loans by industry sector at March 31,
2002 and March 31, 2003.
Rs. billion, except percentages
March 31, March 31,
2002 2003
% of total % of total Net
outstanding
Textiles .......................................................................... 15.1 16.3 5.27
Iron & steel ................................................................... 15.4 13.3 4.30
Man-made fibres .......................................................... 8.3 9.8 3.17
Engineering .................................................................. 7.0 8.9 2.90
Chemicals ..................................................................... 7.9 8.7 2.83
Metal & metal products .............................................. 5.8 6.9 2.23
Services ........................................................................ 0.7 4.8 1.57
Food processing .......................................................... 4.9 3.2 1.04
Paper & paper products .............................................. 4.0 3.0 0.96
Petrochemicals ............................................................. 4.0 2.7 0.87
Drugs ............................................................................ 3.4 2.5 0.81
Cement ......................................................................... 3.0 2.4 0.79
Plastic ........................................................................... 2.7 2.1 0.69
Electronics .................................................................... 2.2 2.0 0.65
Sugar ............................................................................ 1.6 1.9 0.63
Rubber & rubber products .......................................... 0.7 0.7 0.23
Shipping ....................................................................... 0.9 0.6 0.19
Non-banking finance companies ................................ 0.9 0.2 0.07
Hotels ........................................................................... 1.5 0.2 0.05
Miscellaneous & others ............................................... 10.0 9.8 3.17
Total of above .............................................................. 100.0 100.0 32.42
Less: general provisions against non-performing loans 0.91
Net non-performing loans ........................................... 31.51