ICICI Bank 2003 Annual Report Download - page 86
Download and view the complete annual report
Please find page 86 of the 2003 ICICI Bank annual report below. You can navigate through the pages in the report by either clicking on the pages listed below, or by using the keyword search tool below to find specific information within the annual report.-
 1
1 -
2
-
3
-
4
-
5
-
6
-
7
-
8
-
9
-
10
-
11
-
12
-
13
-
14
-
15
-
16
-
17
-
18
-
19
-
20
-
21
-
22
-
23
-
24
-
25
-
26
-
27
-
28
-
29
-
30
-
31
-
32
-
33
-
34
-
35
-
36
-
37
-
38
-
39
-
40
-
41
-
42
-
43
-
44
-
45
-
46
-
47
-
48
-
49
-
50
-
51
-
52
-
53
-
54
-
55
-
56
-
57
-
58
-
59
-
60
-
61
-
62
-
63
-
64
-
65
-
66
-
67
-
68
-
69
-
70
-
71
-
72
-
73
-
74
-
75
-
 76
76 -
 77
77 -
 78
78 -
 79
79 -
 80
80 -
 81
81 -
 82
82 -
 83
83 -
 84
84 -
 85
85 -
 86
86 -
 87
87 -
 88
88 -
 89
89 -
 90
90 -
 91
91 -
 92
92 -
 93
93 -
 94
94 -
 95
95 -
 96
96 -
97
-
98
-
99
-
100
-
101
-
102
-
103
-
104
-
105
-
106
-
107
-
108
-
109
-
110
-
111
-
112
-
113
-
114
-
115
-
116
-
117
-
118
-
119
-
120
-
121
-
122
-
123
-
124
-
125
-
126
-
127
-
128
-
129
-
130
-
131
-
132
-
133
-
134
-
135
-
136
-
137
-
138
-
139
-
140
-
141
-
142
-
143
-
144
-
145
-
146
-
147
-
148
-
149
-
150
-
151
-
152
-
153
-
154
-
155
-
156
-
157
-
158
-
159
-
160
-
161
-
162
-
163
-
164
 |
 |

F22
forming part of the Accounts Continued
schedules
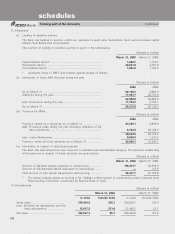
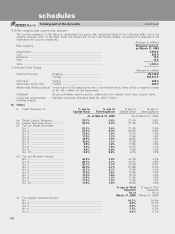
11.4 Advances
(i) Lending to sensitive sectors
The Bank has lending to sectors, which are, sensitive to asset price fluctuations. Such sectors include Capital
Market, Real Estate and Commodities.
The position of lending to sensitive sectors is given in the table below :
(Rupees in million)
March 31, 2003 March 31, 2002
Capital Market Sector* ..................................................................... 1,692.7 1,715.5
Real Estate Sector ............................................................................ 20,941.8 4,757.8
Commodities Sector ......................................................................... 1,663.6 1,109.6
* represents loans to NBFC and brokers against pledge of shares.
(ii) Movement of Gross NPA (Funded) during the year
(Rupees in million)
2003 2002
As on March 31 ................................................................................ 50,130.3 4,092.5
Additions during the year ................................................................. 11,937.7 48,772.9
62,068.0 52,865.4
Less: Reductions during the year .................................................... 11,794.2 2,735.1
As on March 31 ................................................................................ 50,273.8 50,130.3
(iii) Provision for NPAs
(Rupees in million)
2003 2002
Provision netted from Advances as on March 31 .......................... 23,838.1 2,059.0
Add: Provisions made during the year (including utilisation of fair
value provisions) ...................................................................... 6,704.8 23,120.3
30,542.9 25,179.3
Less: write-offs/recovery ................................................................... 8,506.8 1,341.2
Provision netted off from advances as on March 31 .................... 22,036.1 23,838.1
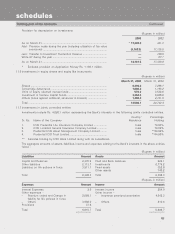
(iv) Information in respect of restructured assets
The Bank has restructured borrower accounts in standard and sub-standard category. The amounts outstanding
at the year-end in respect of these accounts are given below :
(Rupees in million)
March 31, 2003 March 31, 2002
Amount of Standard assets subjected to restructuring ................. *89,431.7 46,978.4
Amount of Sub-standard assets subjected to restructuring .......... —177.4
Total amount of loan assets subjected to restructuring ................ 89,431.7 47,155.8
* The above includes assets amounting to Rs. 39,282.4 million subject to restructuring under Corporate Debt
Restructuring mechanism constituted by Reserve Bank of India.
11.5 Investments
(Rupees in million)
March 31, 2003 March 31, 2002
In India Outside India In India Outside India
Gross value ............................................. 370,454.5 356.7 380,232.1 142.9
Less: Provision for depreciation and Fair
Value adjustments ........................ 15,917.2 271.0 21,442.5 21.7
Net value ................................................ 354,537.3 85.7 358,789.6 121.2