ICICI Bank 2003 Annual Report Download - page 75
Download and view the complete annual report
Please find page 75 of the 2003 ICICI Bank annual report below. You can navigate through the pages in the report by either clicking on the pages listed below, or by using the keyword search tool below to find specific information within the annual report.-
 1
1 -
2
-
3
-
4
-
5
-
6
-
7
-
8
-
9
-
10
-
11
-
12
-
13
-
14
-
15
-
16
-
17
-
18
-
19
-
20
-
21
-
22
-
23
-
24
-
25
-
26
-
27
-
28
-
29
-
30
-
31
-
32
-
33
-
34
-
35
-
36
-
37
-
38
-
39
-
40
-
41
-
42
-
43
-
44
-
45
-
46
-
47
-
48
-
49
-
50
-
51
-
52
-
53
-
54
-
55
-
56
-
57
-
58
-
59
-
60
-
61
-
62
-
63
-
64
-
 65
65 -
 66
66 -
 67
67 -
 68
68 -
 69
69 -
 70
70 -
 71
71 -
 72
72 -
 73
73 -
 74
74 -
 75
75 -
 76
76 -
 77
77 -
 78
78 -
 79
79 -
 80
80 -
 81
81 -
 82
82 -
 83
83 -
 84
84 -
 85
85 -
86
-
87
-
88
-
89
-
90
-
91
-
92
-
93
-
94
-
95
-
96
-
97
-
98
-
99
-
100
-
101
-
102
-
103
-
104
-
105
-
106
-
107
-
108
-
109
-
110
-
111
-
112
-
113
-
114
-
115
-
116
-
117
-
118
-
119
-
120
-
121
-
122
-
123
-
124
-
125
-
126
-
127
-
128
-
129
-
130
-
131
-
132
-
133
-
134
-
135
-
136
-
137
-
138
-
139
-
140
-
141
-
142
-
143
-
144
-
145
-
146
-
147
-
148
-
149
-
150
-
151
-
152
-
153
-
154
-
155
-
156
-
157
-
158
-
159
-
160
-
161
-
162
-
163
-
164
 |
 |
F11
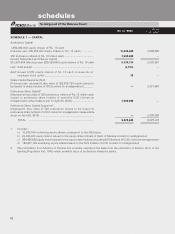
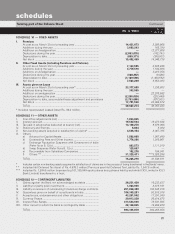
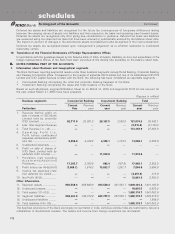
SCHEDULE 10 — FIXED ASSETS
I. Premises
At cost as on March 31st of preceding year ................................. 14,431,673 2,030,868
Additions during the year .............................................................. 3,683,243 165,790
Additions on Amalgamation .......................................................... —12,377,806
Deductions during the year ........................................................... (2,053,076) (142,791)
Depreciation to date ...................................................................... (659,371) (390,937)
Net block ....................................................................................... 15,402,469 14,040,736
II. Other Fixed Assets (including Furniture and Fixtures)
At cost as on March 31st of preceding year ................................. 7,133,585 2,535,245
Additions during the year .............................................................. 3,779,516 1,194,808
Additions on Amalgamation .......................................................... —3,413,358
Deductions during the year ........................................................... (300,252) (9,826)
Depreciation to date ...................................................................... (3,109,580) (1,480,552)
Net block ....................................................................................... 7,503,269 5,653,033
III. Assets given on Lease
At cost as on March 31st of preceding year* ............................... 23,377,605 1,330,663
Additions during the year .............................................................. 343,565 —
Additions on amalgamation .......................................................... —22,270,582
Deductions during the year ........................................................... (2,266,029) (223,640)
Depreciation to date, accumulated lease adjustment and provisions (3,753,605) (677,931)
Net block ....................................................................................... 17,701,536 22,699,674
TOTAL ............................................................................................ 40,607,274 42,393,443
* Includes repossessed Leased Asset Rs. 96.0 million.
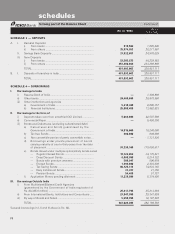
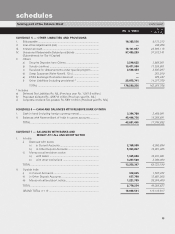
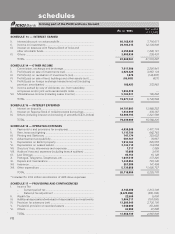
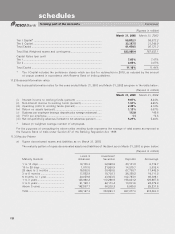
SCHEDULE 11 — OTHER ASSETS
I. Inter-office adjustments (net) ........................................................ 1,034,655 —
II. Interest accrued ............................................................................. 19,582,564 18,473,846
III. Tax paid in advance/tax deducted at source (net) ......................... 14,140,278 9,870,068
IV. Stationery and Stamps .................................................................. 8,084 5,034
V. Non-banking assets acquired in satisfaction of claims* ............... 4,538,354 2,067,795
VI. Others
a) Advance for Capital Assets .................................................. 1,562,088 1,987,449
b) Outstanding Fees and Other Income ................................... 1,776,206 1,910,861
c) Exchange Fluctuation Suspense with Government of India
(Refer Note B. 12 b) .............................................................. 923,573 1,111,919
d) Swap Suspense (Refer Note B. 12 c) ................................... 128,667 —
e) Recoverable from Subsidiary Companies ............................ 182,276 199,341
f) Others ** .............................................................................. 31,328,471 ***5,920,298
TOTAL ............................................................................................ 75,205,216 41,546,611
* Includes certain non-banking assets acquired in satisfaction of claims are in the process of being transferred in the Banks’ name.
* * Includes Net Deferred Tax Asset of Rs. 4,878.3 million [Previous year Net Deferred Tax Liability Rs. 1,547.6 million].
*** Includes Rs. 1,244.5 million [representing 101,395,949 equity shares being shares held by erstwhile ICICI Limited in ICICI
Bank Limited] transferred to a trust.
SCHEDULE 12 — CONTINGENT LIABILITIES
I. Claims against the Bank not acknowledged as debts .................. 20,251,450 10,232,637
II. Liability for partly paid investments .............................................. 1,804,936 2,615,161
III. Liability on account of outstanding forward exchange contracts . 251,030,498 152,545,916
IV. Guarantees given on behalf of constituents in India .................... 106,348,281 93,516,016
V. Acceptances, endorsements and other obligations ..................... 43,251,942 17,391,049
VI. Currency Swaps ............................................................................. 29,013,220 20,414,675
VII. Interest Rate Swaps ...................................................................... 413,544,698 78,541,565
VIII. Other items for which the Bank is contingently liable .................. 29,140,045 19,208,839
TOTAL ............................................................................................ 894,385,070 394,465,858
(Rs. in ‘000s) As on
31.03.2002
forming part of the Balance Sheet Continued
schedules