CenturyLink 2015 Annual Report Download - page 71
Download and view the complete annual report
Please find page 71 of the 2015 CenturyLink annual report below. You can navigate through the pages in the report by either clicking on the pages listed below, or by using the keyword search tool below to find specific information within the annual report.-
 1
1 -
2
-
3
-
4
-
5
-
6
-
7
-
8
-
9
-
10
-
11
-
12
-
13
-
14
-
15
-
16
-
17
-
18
-
19
-
20
-
21
-
22
-
23
-
24
-
25
-
26
-
27
-
28
-
29
-
30
-
31
-
32
-
33
-
34
-
35
-
36
-
37
-
38
-
39
-
40
-
41
-
42
-
43
-
44
-
45
-
46
-
47
-
48
-
49
-
50
-
51
-
52
-
53
-
54
-
55
-
56
-
57
-
58
-
59
-
60
-
 61
61 -
 62
62 -
 63
63 -
 64
64 -
 65
65 -
 66
66 -
 67
67 -
 68
68 -
 69
69 -
 70
70 -
 71
71 -
 72
72 -
 73
73 -
 74
74 -
 75
75 -
 76
76 -
 77
77 -
 78
78 -
 79
79 -
 80
80 -
 81
81 -
82
-
83
-
84
-
85
-
86
-
87
-
88
-
89
-
90
-
91
-
92
-
93
-
94
-
95
-
96
-
97
-
98
-
99
-
100
-
101
-
102
-
103
-
104
-
105
-
106
-
107
-
108
-
109
-
110
-
111
-
112
-
113
-
114
-
115
-
116
-
117
-
118
-
119
-
120
-
121
-
122
-
123
-
124
-
125
-
126
-
127
-
128
-
129
-
130
-
131
-
132
-
133
-
134
-
135
-
136
-
137
-
138
-
139
-
140
-
141
-
142
-
143
-
144
-
145
-
146
-
147
-
148
-
149
-
150
-
151
-
152
-
153
-
154
-
155
-
156
-
157
-
158
-
159
-
160
-
161
-
162
-
163
-
164
-
165
-
166
-
167
-
168
-
169
-
170
-
171
-
172
-
173
-
174
-
175
-
176
-
177
-
178
-
179
-
180
-
181
-
182
-
183
-
184
-
185
-
186
-
187
-
188
-
189
-
190
-
191
-
192
-
193
-
194
-
195
-
196
-
197
-
198
-
199
-
200
-
201
-
202
 |
 |

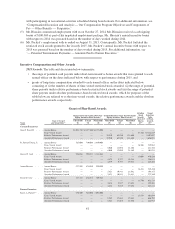
The aggregate value of the restricted stock awards granted to these named executives in 2015, based on the grant
date closing trading price of our Common Shares and assuming maximum payout of his or her performance-
based restricted shares, would be as follows: Mr. Post, $12,858,595, Mr. Ewing, $2,359,924, Mr. Goff,
$1,906,115, Mr. Hussain, $2,117,873, Mr. Cole, $1,724,540, and Ms. Puckett, $3,454,832. See Note 8 titled
“Share-based Compensation” of the notes to our audited financial statements included in Appendix B for an
explanation of material assumptions that we used to calculate the fair value of these stock awards.
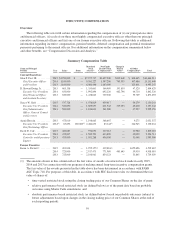
(2) The amounts shown in this column reflect cash payments made under our annual incentive bonus plans for
actual performance in the respective years. For additional information, see “— Incentive Compensation and
Other Awards — 2015 Awards.”
(3) Reflects the net change during each of the years reflected in the present value of the named executives’
accumulated benefits under the defined benefit plans discussed below under the heading “— Pension
Benefits.” In 2015, the present value of the accumulated benefits under those defined pension plans
decreased by $123,573 for Mr. Goff and $111,772 for Mr. Cole (primarily due to (i) an additional year of
benefit accrual, (ii) a one year decrease in the discount period and (iii) changes in both the discount rate and
mortality assumption from 2014 to 2015). Each of our named executives experienced negative changes in
2013 in the value of their pensions under these plans (primarily due to increases in the discount rates used to
value pension liabilities). The present value of the accumulated benefits under these plans decreased during
2013 by $125,605 for Mr. Post, $91,118 for Mr. Ewing, $118,903 for Mr. Goff, $158,184 for Mr. Cole and
$195,547 for Ms. Puckett. SEC rules dictate that each of these 2015 and 2013 decreases be treated as a $0
Change in Pension Value for purposes of calculating total compensation. For information on payments made
in 2015 to Ms. Puckett under our qualified pension plan, see “— Pension Benefits” below.
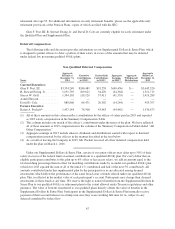
(4) The amounts shown in this column are comprised of (i) reimbursements for the cost of an annual physical
examination, (ii) personal use of our aircraft, (iii) contributions or other allocations to our defined contribution
plans, (iv) reimbursements of the cost of relocating one of our named executives and his family from Europe to
the site of our headquarters office in 2014, including without limitation residential closing costs, travel costs,
moving expenses, loss on the sale of a vehicle and lease termination penalties (aggregating to $324,903), plus
related tax-gross up payments of $20,042, and (v) amounts paid by us to one of our former executives for post-
termination payments, consisting of cash severance payments of $1,560,599 and the cost of continued pension
and welfare benefits estimated at $36,500, in each case for and on behalf of the named executives as follows:
Name Year
Physical
Exam
Aircraft
Use
Contributions
to Plans
Relocation
Costs
Post
Termination
Payments Total
Current Executives:
Mr. Post ..................... 2015 $3,035 $ 6,120 $ 99,490 $ — $ — $ 108,645
2014 2,831 7,500 97,155 — — 107,486
2013 4,026 17,920 101,855 — — 123,801
Mr. Ewing ................... 2015 3,775 — 43,745 — — 47,520
2014 — — 44,710 — — 44,710
2013 — 7,400 48,369 — — 55,769
Mr. Goff .................... 2015 7,441 6,600 40,238 — — 54,279
2014 — 7,758 37,842 — — 45,600
2013 — 9,510 28,017 — — 37,527
Mr. Hussain .................. 2015 — — 9,275 — — 9,275
2014 — — — 344,945 — 344,945
Mr. Cole .................... 2015 3.383 — 29,577 — — 32,960
2014 — — 30,092 — — 30,092
2013 — — 31,048 — — 31,048
Former Executive:
Ms. Puckett .................. 2015 2,956 6,250 46,391 — 1,597,099 1,652,696
2014 2,936 1,705 55,269 — — 59,910
2013 — — 53,845 — — 53,845
In accordance with applicable SEC and accounting rules, we have not reflected the accrual or payment of
dividends relating to unvested restricted stock as compensation in the Summary Compensation Table. In
addition, the amounts shown in the Summary Compensation Table do not reflect any benefits associated
60