CenturyLink 2015 Annual Report Download - page 50
Download and view the complete annual report
Please find page 50 of the 2015 CenturyLink annual report below. You can navigate through the pages in the report by either clicking on the pages listed below, or by using the keyword search tool below to find specific information within the annual report.-
 1
1 -
2
-
3
-
4
-
5
-
6
-
7
-
8
-
9
-
10
-
11
-
12
-
13
-
14
-
15
-
16
-
17
-
18
-
19
-
20
-
21
-
22
-
23
-
24
-
25
-
26
-
27
-
28
-
29
-
30
-
31
-
32
-
33
-
34
-
35
-
36
-
37
-
38
-
39
-
 40
40 -
 41
41 -
 42
42 -
 43
43 -
 44
44 -
 45
45 -
 46
46 -
 47
47 -
 48
48 -
 49
49 -
 50
50 -
 51
51 -
 52
52 -
 53
53 -
 54
54 -
 55
55 -
 56
56 -
 57
57 -
 58
58 -
 59
59 -
 60
60 -
61
-
62
-
63
-
64
-
65
-
66
-
67
-
68
-
69
-
70
-
71
-
72
-
73
-
74
-
75
-
76
-
77
-
78
-
79
-
80
-
81
-
82
-
83
-
84
-
85
-
86
-
87
-
88
-
89
-
90
-
91
-
92
-
93
-
94
-
95
-
96
-
97
-
98
-
99
-
100
-
101
-
102
-
103
-
104
-
105
-
106
-
107
-
108
-
109
-
110
-
111
-
112
-
113
-
114
-
115
-
116
-
117
-
118
-
119
-
120
-
121
-
122
-
123
-
124
-
125
-
126
-
127
-
128
-
129
-
130
-
131
-
132
-
133
-
134
-
135
-
136
-
137
-
138
-
139
-
140
-
141
-
142
-
143
-
144
-
145
-
146
-
147
-
148
-
149
-
150
-
151
-
152
-
153
-
154
-
155
-
156
-
157
-
158
-
159
-
160
-
161
-
162
-
163
-
164
-
165
-
166
-
167
-
168
-
169
-
170
-
171
-
172
-
173
-
174
-
175
-
176
-
177
-
178
-
179
-
180
-
181
-
182
-
183
-
184
-
185
-
186
-
187
-
188
-
189
-
190
-
191
-
192
-
193
-
194
-
195
-
196
-
197
-
198
-
199
-
200
-
201
-
202
 |
 |

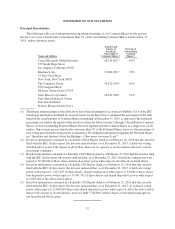
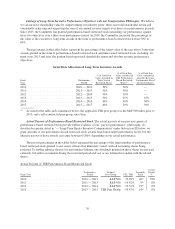
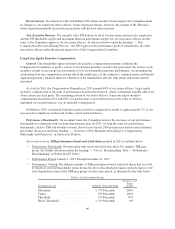
Linkage of Long-Term Incentive Performance Objectives with our Compensation Philosophy. We believe
we can increase shareholder value by outperforming our industry peers’ three-year total shareholder return and
consistently achieving and surpassing the sum of our annual revenue targets over three-year performance periods.
Since 2013, the Committee has granted performance-based restricted stock measuring our performance against
these two objectives over a three-year performance period. In 2014, the Committee increased the percentage of
the value of the executives’ long-term awards in the form of performance-based restricted stock from 50% to
60%.
The percentages in the tables below represent the percentage of the target value of the executives’ long-term
awards granted in the form of performance-based restricted stock and time-vested restricted stock, including, for
grant years 2013 and later, the portion based upon total shareholder return and absolute revenue performance
objectives.
Grant Date Allocation of Long-Term Incentive Awards
Grant
Year
Performance
Period
% of Total Fair
Value Awarded in
Time-Vested
Restricted Shares
% of Total Fair
Value Awarded in
TSR Performance-
Based Restricted
Shares(1)
% of Total Fair
Value Awarded in
Absolute Revenue
Performance-Based
Restricted Shares
2010 ............................... 2010 — 2012 50% 50% —
2011 ............................... 2011 — 2013 50% 50% —
2012 ............................... 2012 — 2014 50% 50% —
2013 ............................... 2013 — 2015 50% 25% 25%
2014 ............................... 2014 — 2016 40% 30% 30%
2015 ............................... 2015 — 2017 40% 30% 30%
(1) As noted in the table and commentary below, the applicable TSR peer group was the S&P 500 index prior to
2013, and a self-constructed peer group since then.
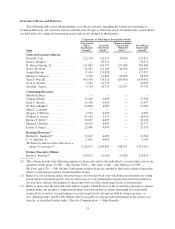
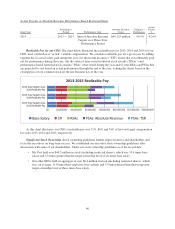
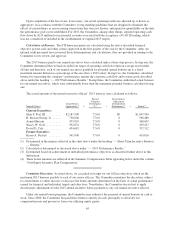
Actual Payouts of Performance-Based Restricted Stock. The actual payouts of our previous grants of
performance-based restricted stock provide further evidence of our “pay for performance” philosophy. As
described in greater detail in “— Long-Term Equity Incentive Compensation” under Subsection III below, we
grant amounts of our performance-based restricted stock awards based upon target performance levels, but the
ultimate payout of those awards can range between 0-200% depending on our actual performance.
The payout percentages in the tables below represent the percentage of the target number of performance-
based restricted stock granted to our senior officers that ultimately vested, with all remaining shares being
forfeited. To further enhance the pay for performance linkage, any dividends granted on these shares are not paid
currently, but rather accumulate during the restricted period and vest or are forfeited in tandem with the related
shares.
Actual Payouts of TSR Performance-Based Restricted Stock
Grant Year
Performance
Period
Defined
Peer Group CTL TSR
Percentile
Rank
Actual
Payout
%
2010 ................................... 2010 — 2012 S&P 500 35.29% 46th 92%
2011 ................................... 2011 — 2013 S&P 500 -14.42% 9th 0%
2012 ................................... 2012 — 2014 S&P 500 33.32% 19th 0%
2013 ................................... 2013 — 2015 TSR Peer Group -19.47% 16th 0%
39