CenturyLink 2015 Annual Report Download - page 187
Download and view the complete annual report
Please find page 187 of the 2015 CenturyLink annual report below. You can navigate through the pages in the report by either clicking on the pages listed below, or by using the keyword search tool below to find specific information within the annual report.-
 1
1 -
2
-
3
-
4
-
5
-
6
-
7
-
8
-
9
-
10
-
11
-
12
-
13
-
14
-
15
-
16
-
17
-
18
-
19
-
20
-
21
-
22
-
23
-
24
-
25
-
26
-
27
-
28
-
29
-
30
-
31
-
32
-
33
-
34
-
35
-
36
-
37
-
38
-
39
-
40
-
41
-
42
-
43
-
44
-
45
-
46
-
47
-
48
-
49
-
50
-
51
-
52
-
53
-
54
-
55
-
56
-
57
-
58
-
59
-
60
-
61
-
62
-
63
-
64
-
65
-
66
-
67
-
68
-
69
-
70
-
71
-
72
-
73
-
74
-
75
-
76
-
77
-
78
-
79
-
80
-
81
-
82
-
83
-
84
-
85
-
86
-
87
-
88
-
89
-
90
-
91
-
92
-
93
-
94
-
95
-
96
-
97
-
98
-
99
-
100
-
101
-
102
-
103
-
104
-
105
-
106
-
107
-
108
-
109
-
110
-
111
-
112
-
113
-
114
-
115
-
116
-
117
-
118
-
119
-
120
-
121
-
122
-
123
-
124
-
125
-
126
-
127
-
128
-
129
-
130
-
131
-
132
-
133
-
134
-
135
-
136
-
137
-
138
-
139
-
140
-
141
-
142
-
143
-
144
-
145
-
146
-
147
-
148
-
149
-
150
-
151
-
152
-
153
-
154
-
155
-
156
-
157
-
158
-
159
-
160
-
161
-
162
-
163
-
164
-
165
-
166
-
167
-
168
-
169
-
170
-
171
-
172
-
173
-
174
-
175
-
176
-
 177
177 -
 178
178 -
 179
179 -
 180
180 -
 181
181 -
 182
182 -
 183
183 -
 184
184 -
 185
185 -
 186
186 -
 187
187 -
 188
188 -
 189
189 -
 190
190 -
 191
191 -
 192
192 -
 193
193 -
 194
194 -
 195
195 -
 196
196 -
 197
197 -
198
-
199
-
200
-
201
-
202
 |
 |

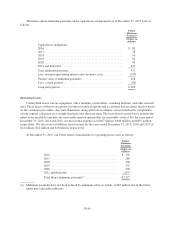
Years Ended December 31,
2015 2014 2013
(Dollars in millions)
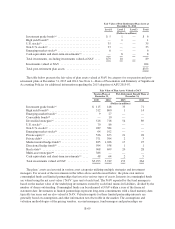
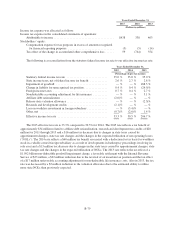
Income tax expense was allocated as follows:
Income tax expense in the consolidated statements of operations:
Attributable to income ......................................... $438 338 463
Stockholders’ equity:
Compensation expense for tax purposes in excess of amounts recognized
for financial reporting purposes ............................... (5) (5) (14)
Tax effect of the change in accumulated other comprehensive loss ...... 59 (744) 554
The following is a reconciliation from the statutory federal income tax rate to our effective income tax rate:
Years Ended December 31,
2015 2014 2013
(Percentage of pre-tax income)
Statutory federal income tax rate ............................ 35.0 % 35.0 % 35.0 %
State income taxes, net of federal income tax benefit ............ 2.6% 2.7% 2.8%
Impairment of goodwill ................................... —% —% 188.5 %
Change in liability for unrecognized tax position ................ 0.4% 0.4% (24.5)%
Foreign income taxes ..................................... 0.7% 0.4% 2.7%
Nondeductible accounting adjustment for life insurance .......... —% —% 3.1%
Affiliate debt rationalization ................................ (2.6)% — % — %
Release state valuation allowance ............................ —% —% (2.3)%
Research and development credits ........................... (2.1)% — % — %
Loss on worthless investment in foreign subsidiary .............. —% (5.4)% — %
Other, net .............................................. (0.7)% (2.6)% 1.4 %
Effective income tax rate .................................. 33.3 % 30.5 % 206.7 %
The 2015 effective tax rate is 33.3% compared to 30.5% for 2014. The 2015 rate reflects a tax benefit of
approximately $34 million related to affiliate debt rationalization, research and development tax credits of $28
million for 2011 through 2015 and a $16 million tax decrease due to changes in state taxes caused by
apportionment changes, state tax rate changes and the changes in the expected utilization of net operating losses
(“NOLs”). The 2014 rate reflects a $60 million tax benefit associated with a deduction for tax basis for worthless
stock in a wholly-owned foreign subsidiary as a result of developments in bankruptcy proceedings involving its
sole asset and a $13 million tax decrease due to changes in the state taxes caused by apportionment changes, state
tax rate changes and the changes in the expected utilization of NOLs. The 2013 rate reflects the tax effect of a
$1.092 billion non-deductible goodwill impairment charge, a favorable settlement with the Internal Revenue
Service of $33 million, a $22 million reduction due to the reversal of an uncertain tax position and the tax effect
of a $17 million unfavorable accounting adjustment for non-deductible life insurance costs. Also in 2013, the tax
rate was decreased by a $5 million reduction to the valuation allowance due to the estimated ability to utilize
more state NOLs than previously expected.
B-79