CenturyLink 2015 Annual Report Download - page 55
Download and view the complete annual report
Please find page 55 of the 2015 CenturyLink annual report below. You can navigate through the pages in the report by either clicking on the pages listed below, or by using the keyword search tool below to find specific information within the annual report.-
 1
1 -
2
-
3
-
4
-
5
-
6
-
7
-
8
-
9
-
10
-
11
-
12
-
13
-
14
-
15
-
16
-
17
-
18
-
19
-
20
-
21
-
22
-
23
-
24
-
25
-
26
-
27
-
28
-
29
-
30
-
31
-
32
-
33
-
34
-
35
-
36
-
37
-
38
-
39
-
40
-
41
-
42
-
43
-
44
-
 45
45 -
 46
46 -
 47
47 -
 48
48 -
 49
49 -
 50
50 -
 51
51 -
 52
52 -
 53
53 -
 54
54 -
 55
55 -
 56
56 -
 57
57 -
 58
58 -
 59
59 -
 60
60 -
 61
61 -
 62
62 -
 63
63 -
 64
64 -
 65
65 -
66
-
67
-
68
-
69
-
70
-
71
-
72
-
73
-
74
-
75
-
76
-
77
-
78
-
79
-
80
-
81
-
82
-
83
-
84
-
85
-
86
-
87
-
88
-
89
-
90
-
91
-
92
-
93
-
94
-
95
-
96
-
97
-
98
-
99
-
100
-
101
-
102
-
103
-
104
-
105
-
106
-
107
-
108
-
109
-
110
-
111
-
112
-
113
-
114
-
115
-
116
-
117
-
118
-
119
-
120
-
121
-
122
-
123
-
124
-
125
-
126
-
127
-
128
-
129
-
130
-
131
-
132
-
133
-
134
-
135
-
136
-
137
-
138
-
139
-
140
-
141
-
142
-
143
-
144
-
145
-
146
-
147
-
148
-
149
-
150
-
151
-
152
-
153
-
154
-
155
-
156
-
157
-
158
-
159
-
160
-
161
-
162
-
163
-
164
-
165
-
166
-
167
-
168
-
169
-
170
-
171
-
172
-
173
-
174
-
175
-
176
-
177
-
178
-
179
-
180
-
181
-
182
-
183
-
184
-
185
-
186
-
187
-
188
-
189
-
190
-
191
-
192
-
193
-
194
-
195
-
196
-
197
-
198
-
199
-
200
-
201
-
202
 |
 |

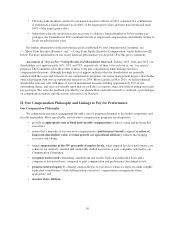
selected individual performance objectives and (iv) the officer’s individual scoring under our management
performance rating system.
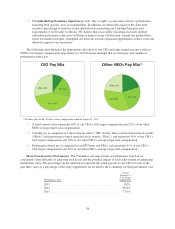
2015 Performance Results. In February 2016, the Compensation Committee reviewed audited results of the
Company’s performance as compared to the financial performance targets established for 2015. Based on the
calculations described below, the Committee determined that the aggregate earned performance for these
performance targets was 77.6% for our named executive officers, as described further below.
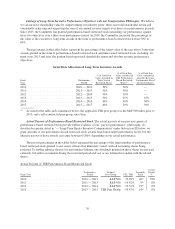
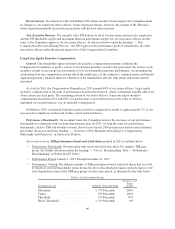
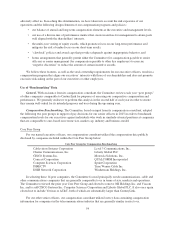
During 2015, we achieved the financial results described below which, based on the financial objective
payout scale in the table below under heading “— Calculation of Bonuses,” resulted in the following earned
performance level for each financial objective:
$6.74
$6.56
$6.90
$7.25
2015 Q4 STI Threshold STI Target
STI Maximum
2015 Operating Cash Flow (in billions)
$16.10
$15.78
$16.35
$16.92
2015 Q4 STI Threshold STI Target STI Maximum
2015 Core Revenue (in billions)
200% Payout
100% Payout
50% Payout
100% Payout
200% Payout
50% Payout
77.4%
Payout 77.7%
Payout
•162(m) Target — Operating Cash Flow Return on Average Assets. We attained a 13.9% operating cash
flow return on average assets, which exceeded the target level established by the Committee in
February 2015 for purposes of fixing the maximum amount of potential annual bonuses for 2015
payable to our senior officers in accordance with Section 162(m) of the Internal Revenue Code.
•Operating Cash Flow. We achieved consolidated operating cash flow results of $6.7445 billion (which
excludes certain revenue associated with our acceptance of CAF II funding for the reasons noted
below), which was slightly below our target of $6.9 billion, thereby resulting in earned performance of
77.54% of the target level.
•Core Revenue. We achieved consolidated core revenue results of $16.095 billion, which was slightly
below our target of $16.35 billion, thereby resulting in earned performance of 77.7% of the target level.
•Individual Performance Objectives. The Committee reviewed with management the degree to which
each senior officer met certain specific individual performance objectives and benchmarks, as well as
qualitative assessments of each officer’s performance. Based on these assessments, the Committee
elected not to make individual performance adjustments for any of our named executive officers.
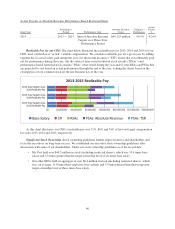
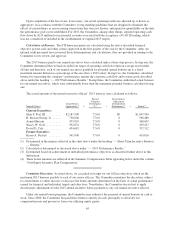
We used the following scale, which was approved in 2015, to calculate bonus amounts payable with respect
to company performance.
Financial Objective Payout Scale
Performance Level
Consolidated
Operating
Cash Flow
Consolidated
Core
Revenue
Percentage
of Earned
Performance
Maximum ................................ ≥105.0% ≥103.5% 200%
Target ................................... 100.0% 100.0% 100%
Threshold ................................. 95.0% 96.5% 50%
Below Threshold ........................... <95.0% < 96.5% 0%
44