CenturyLink 2015 Annual Report Download - page 161
Download and view the complete annual report
Please find page 161 of the 2015 CenturyLink annual report below. You can navigate through the pages in the report by either clicking on the pages listed below, or by using the keyword search tool below to find specific information within the annual report.-
 1
1 -
2
-
3
-
4
-
5
-
6
-
7
-
8
-
9
-
10
-
11
-
12
-
13
-
14
-
15
-
16
-
17
-
18
-
19
-
20
-
21
-
22
-
23
-
24
-
25
-
26
-
27
-
28
-
29
-
30
-
31
-
32
-
33
-
34
-
35
-
36
-
37
-
38
-
39
-
40
-
41
-
42
-
43
-
44
-
45
-
46
-
47
-
48
-
49
-
50
-
51
-
52
-
53
-
54
-
55
-
56
-
57
-
58
-
59
-
60
-
61
-
62
-
63
-
64
-
65
-
66
-
67
-
68
-
69
-
70
-
71
-
72
-
73
-
74
-
75
-
76
-
77
-
78
-
79
-
80
-
81
-
82
-
83
-
84
-
85
-
86
-
87
-
88
-
89
-
90
-
91
-
92
-
93
-
94
-
95
-
96
-
97
-
98
-
99
-
100
-
101
-
102
-
103
-
104
-
105
-
106
-
107
-
108
-
109
-
110
-
111
-
112
-
113
-
114
-
115
-
116
-
117
-
118
-
119
-
120
-
121
-
122
-
123
-
124
-
125
-
126
-
127
-
128
-
129
-
130
-
131
-
132
-
133
-
134
-
135
-
136
-
137
-
138
-
139
-
140
-
141
-
142
-
143
-
144
-
145
-
146
-
147
-
148
-
149
-
150
-
 151
151 -
 152
152 -
 153
153 -
 154
154 -
 155
155 -
 156
156 -
 157
157 -
 158
158 -
 159
159 -
 160
160 -
 161
161 -
 162
162 -
 163
163 -
 164
164 -
 165
165 -
 166
166 -
 167
167 -
 168
168 -
 169
169 -
 170
170 -
 171
171 -
172
-
173
-
174
-
175
-
176
-
177
-
178
-
179
-
180
-
181
-
182
-
183
-
184
-
185
-
186
-
187
-
188
-
189
-
190
-
191
-
192
-
193
-
194
-
195
-
196
-
197
-
198
-
199
-
200
-
201
-
202
 |
 |

resulted in a Level 3 fair value measurement. The market approach method includes the use of comparable
multiples of publicly traded companies whose services are comparable to ours. The discounted cash flow method
is based on the present value of projected cash flows and a terminal value, which represents the expected
normalized cash flows of the reporting units beyond the cash flows from the discrete projection period. We
discounted the estimated cash flows for our consumer and wholesale reporting units using a rate that represents
their estimated weighted average cost of capital, which we determined to be approximately 6.0% as of the
assessment date (which was comprised of an after-tax cost of debt of 3.3% and a cost of equity of 7.6%). We
discounted the estimated cash flows of our business (excluding wholesale) reporting unit using a rate that
represents its estimated weighted average cost of capital, which we determined to be approximately 7.0% as of
the assessment date (which was comprised of an after-tax cost of debt of 3.3% and a cost of equity of 8.6%). We
also reconciled the estimated fair values of the reporting units to our market capitalization as of October 31, 2015
and concluded that the indicated implied control premium of approximately 24.6% was reasonable based on
recent transactions in the market place. As of October 31, 2015, based on our assessment performed with respect
to these reporting units as described above, we concluded that our goodwill for our three reporting units was not
impaired as of that date.
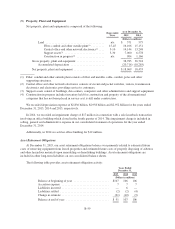
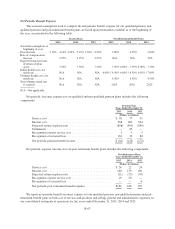
The following table shows the rollforward of goodwill assigned to our reportable segments from
December 31, 2013 through December 31, 2015.
Business Consumer Wholesale Hosting Total
(Dollars in millions)
As of December 31, 2013 ............................. $ 6,363 10,348 3,274 689 20,674
Purchase accounting adjustments ................... — — — (11) (11)
November 1, 2014 reorganization .................. 4,022 (70) (3,274) (678) —
Acquisitions ................................... 92 — — — 92
As of December 31, 2014 ............................. $10,477 10,278 — — 20,755
Purchase accounting and other adjustments ........... (13) — — — (13)
As of December 31, 2015 ............................. $10,464 10,278 — — 20,742
During the year ended December 31, 2014, we acquired all of the outstanding stock of two companies for
total consideration of $95 million, net of $2 million acquired cash and including immaterial future cash payments
of which $92 million was attributed to goodwill and the remainder to various assets and liabilities. During 2015,
we finalized the valuations for these acquisitions resulting in a $14 million decrease in goodwill, a $13 million
increase in other intangible assets and a $1 million decrease in deferred income taxes, net. The acquisitions were
consummated to expand the product offerings of our business segment and therefore the goodwill has been
assigned to that segment. The goodwill is attributed primarily to expected future increases in business segment
revenue from the sale of new products. The goodwill is not deductible for tax purposes.
The acquisitions did not materially impact the consolidated results of operations from the dates of the
acquisitions in 2014 and would not materially impact pro forma results of operations.
For additional information on our segments, see Note 12—Segment Information.
We completed our qualitative assessment of our indefinite-lived intangible assets other than goodwill as of
December 31, 2015 and concluded it is more likely than not that our indefinite-lived intangible assets are not
impaired; thus, no impairment charge was recorded in 2015.
As of October 31, 2014, based on our assessment performed, we concluded that our goodwill for our then
four reporting units was not impaired as of that date. During 2013, one of our previous reporting units
experienced slower than previously projected revenues and margin growth and greater than anticipated
competitive pressures and as a result, we recorded a non-cash, non-tax-deductible goodwill impairment charge of
$1.092 billion for goodwill assigned to one of our then four reporting units.
B-53