CenturyLink 2015 Annual Report Download - page 132
Download and view the complete annual report
Please find page 132 of the 2015 CenturyLink annual report below. You can navigate through the pages in the report by either clicking on the pages listed below, or by using the keyword search tool below to find specific information within the annual report.-
 1
1 -
2
-
3
-
4
-
5
-
6
-
7
-
8
-
9
-
10
-
11
-
12
-
13
-
14
-
15
-
16
-
17
-
18
-
19
-
20
-
21
-
22
-
23
-
24
-
25
-
26
-
27
-
28
-
29
-
30
-
31
-
32
-
33
-
34
-
35
-
36
-
37
-
38
-
39
-
40
-
41
-
42
-
43
-
44
-
45
-
46
-
47
-
48
-
49
-
50
-
51
-
52
-
53
-
54
-
55
-
56
-
57
-
58
-
59
-
60
-
61
-
62
-
63
-
64
-
65
-
66
-
67
-
68
-
69
-
70
-
71
-
72
-
73
-
74
-
75
-
76
-
77
-
78
-
79
-
80
-
81
-
82
-
83
-
84
-
85
-
86
-
87
-
88
-
89
-
90
-
91
-
92
-
93
-
94
-
95
-
96
-
97
-
98
-
99
-
100
-
101
-
102
-
103
-
104
-
105
-
106
-
107
-
108
-
109
-
110
-
111
-
112
-
113
-
114
-
115
-
116
-
117
-
118
-
119
-
120
-
121
-
 122
122 -
 123
123 -
 124
124 -
 125
125 -
 126
126 -
 127
127 -
 128
128 -
 129
129 -
 130
130 -
 131
131 -
 132
132 -
 133
133 -
 134
134 -
 135
135 -
 136
136 -
 137
137 -
 138
138 -
 139
139 -
 140
140 -
 141
141 -
 142
142 -
143
-
144
-
145
-
146
-
147
-
148
-
149
-
150
-
151
-
152
-
153
-
154
-
155
-
156
-
157
-
158
-
159
-
160
-
161
-
162
-
163
-
164
-
165
-
166
-
167
-
168
-
169
-
170
-
171
-
172
-
173
-
174
-
175
-
176
-
177
-
178
-
179
-
180
-
181
-
182
-
183
-
184
-
185
-
186
-
187
-
188
-
189
-
190
-
191
-
192
-
193
-
194
-
195
-
196
-
197
-
198
-
199
-
200
-
201
-
202
 |
 |
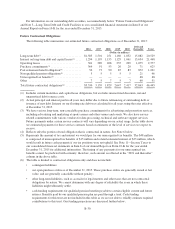
In 2013, approximately 33% of the qualified pension plans’ January 1, 2013 net actuarial loss balance of
$2.221 billion was subject to amortization as a component of net periodic expense over the average remaining
service period of participating employees expected to receive benefits, which ranges from 8 to 12 years for the
plans. The other 67% of the pension plans’ beginning net actuarial loss balance was treated as indefinitely
deferred during 2013. The entire beginning net actuarial loss of $446 million for the post-retirement benefit plans
was treated as indefinitely deferred during 2013.
In computing our pension and post-retirement health care and life insurance benefit obligations, our most
significant assumptions are the discount rate and mortality rates. In computing our periodic pension and post-
retirement benefit expense, our most significant assumptions are the discount rate and the expected rate of return
on plan assets.
The discount rate for each plan is the rate at which we believe we could effectively settle the plan’s benefit
obligations as of the end of the year. We selected each plan’s discount rate based on a cash flow matching
analysis using hypothetical yield curves from U.S. corporate bonds rated high quality and projections of the
future benefit payments that constitute the projected benefit obligation for the plans. This process establishes the
uniform discount rate that produces the same present value of the estimated future benefit payments as is
generated by discounting each year’s benefit payments by a spot rate applicable to that year. The spot rates used
in this process are derived from a yield curve created from yields on the 60th to 90th percentile of U.S. high
quality bonds.
In 2016, we plan to change the method we use to estimate the service and interest components of net
periodic benefit cost for pension and other postretirement benefits. This change will result in a decrease in the
service and interest components in 2016. Beginning in 2016, we plan to utilize a full yield curve approach in the
estimation of these components by applying the specific spot rates along the yield curve used in the
determination of the benefit obligation to the relevant projected cash flows, as opposed to the single weighted-
average discount rate derived from the yield curve that we have used in the past. We believe this change provides
a more precise measurement of service and interest costs by improving the correlation between projected benefit
cash flows to the corresponding spot yield curve rates. This change will not affect the measurement of our total
benefit obligations but is currently expected to lower our annual net periodic benefit cost by approximately
$150 million in 2016. If implemented as expected, this change will be accounted for as a change in accounting
estimate and accordingly will be accounted for prospectively.
Mortality rates help predict the expected life of plan participants and are based on historical demographic
studies by the Society of Actuaries. In 2015, we adopted the revised mortality table and projection scale released
by the Society of Actuaries (“SOA”), which decreased the projected benefit obligation of our benefit plans by
$379 million. In 2014, the SOA published new mortality rate tables reflecting increases in the projected life
expectancies of North Americans since its publications of earlier tables. We adopted the new tables immediately.
This resulted in an increase to the projected benefit obligation of approximately $1.3 billion for our pension and
post-retirement benefit plans.
The expected rate of return on plan assets is the long-term rate of return we expect to earn on the plans’
assets in the future, net of administrative expenses paid from plan assets. The rate of return is determined by the
strategic allocation of plan assets and the long-term risk and return forecast for each asset class. The forecasts for
each asset class are generated primarily from an analysis of the long-term expectations of various third party
investment management organizations to which we then add a factor of 50 basis points to reflect the benefit we
expect to result from our active management of the assets. The expected rate of return on plan assets is reviewed
annually and revised, as necessary, to reflect changes in the financial markets and our investment strategy.
To compute the expected return on pension and post-retirement benefit plan assets, we apply an expected rate
of return to the fair value of the pension plan assets and to the fair value of the post-retirement benefit plan assets
adjusted for contribution timing and for projected benefit payments to be made from the plan assets. Annual market
volatility for these assets (higher or lower than expected return) is reflected in the net actuarial losses.
B-24