CenturyLink 2015 Annual Report Download - page 180
Download and view the complete annual report
Please find page 180 of the 2015 CenturyLink annual report below. You can navigate through the pages in the report by either clicking on the pages listed below, or by using the keyword search tool below to find specific information within the annual report.-
 1
1 -
2
-
3
-
4
-
5
-
6
-
7
-
8
-
9
-
10
-
11
-
12
-
13
-
14
-
15
-
16
-
17
-
18
-
19
-
20
-
21
-
22
-
23
-
24
-
25
-
26
-
27
-
28
-
29
-
30
-
31
-
32
-
33
-
34
-
35
-
36
-
37
-
38
-
39
-
40
-
41
-
42
-
43
-
44
-
45
-
46
-
47
-
48
-
49
-
50
-
51
-
52
-
53
-
54
-
55
-
56
-
57
-
58
-
59
-
60
-
61
-
62
-
63
-
64
-
65
-
66
-
67
-
68
-
69
-
70
-
71
-
72
-
73
-
74
-
75
-
76
-
77
-
78
-
79
-
80
-
81
-
82
-
83
-
84
-
85
-
86
-
87
-
88
-
89
-
90
-
91
-
92
-
93
-
94
-
95
-
96
-
97
-
98
-
99
-
100
-
101
-
102
-
103
-
104
-
105
-
106
-
107
-
108
-
109
-
110
-
111
-
112
-
113
-
114
-
115
-
116
-
117
-
118
-
119
-
120
-
121
-
122
-
123
-
124
-
125
-
126
-
127
-
128
-
129
-
130
-
131
-
132
-
133
-
134
-
135
-
136
-
137
-
138
-
139
-
140
-
141
-
142
-
143
-
144
-
145
-
146
-
147
-
148
-
149
-
150
-
151
-
152
-
153
-
154
-
155
-
156
-
157
-
158
-
159
-
160
-
161
-
162
-
163
-
164
-
165
-
166
-
167
-
168
-
169
-
 170
170 -
 171
171 -
 172
172 -
 173
173 -
 174
174 -
 175
175 -
 176
176 -
 177
177 -
 178
178 -
 179
179 -
 180
180 -
 181
181 -
 182
182 -
 183
183 -
 184
184 -
 185
185 -
 186
186 -
 187
187 -
 188
188 -
 189
189 -
 190
190 -
191
-
192
-
193
-
194
-
195
-
196
-
197
-
198
-
199
-
200
-
201
-
202
 |
 |

Interbank Offered Rate and consider yields available on comparable securities of issuers with similar credit
ratings and are classified as Level 2. The commingled funds are valued at NAV based on the market value of the
underlying investments using the same valuation inputs described above.
Concentrations of Risk: Investments, in general, are exposed to various risks, such as significant world
events, interest rate, credit, foreign currency and overall market volatility risk. These risks are managed by
broadly diversifying assets across numerous asset classes and strategies with differing expected returns,
volatilities and correlations. Risk is also broadly diversified across numerous market sectors and individual
companies. Financial instruments that potentially subject the plans to concentrations of counterparty risk consist
principally of investment contracts with high quality financial institutions. These investment contracts are
typically collateralized obligations and/or are actively managed, limiting the amount of counterparty exposure to
any one financial institution. Although the investments are well diversified, the value of plan assets could change
materially depending upon the overall market volatility, which could affect the funded status of the plans.
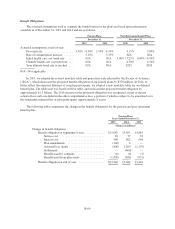
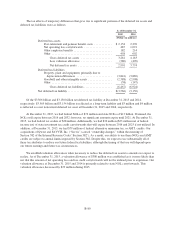
The table below presents a rollforward of the pension plan assets valued using Level 3 inputs:
Pension Plan Assets Valued
Using Level 3 Inputs
High
Yield
Bonds
Emerging
Market
Bonds Total
(Dollars in millions)
Balance at December 31, 2013 .......................... $— — —
Net transfers ......................................... 6 — 6
Acquisitions ......................................... 1 — 1
Dispositions ......................................... (3) — (3)
Actual return on plan assets:
Gains relating to assets sold during the year ............ 4 — 4
(Losses) gains relating to assets still held at year-end ..... (1) — (1)
Balance at December 31, 2014 .......................... 7 — 7
Net transfers ......................................... 4 1 5
Acquisitions ......................................... 4 — 4
Dispositions ......................................... (2) — (2)
Actual return on plan assets:
Gains relating to assets sold during the year ............ — — —
(Losses) gains relating to assets still held at year-end ..... — — —
Balance at December 31, 2015 .......................... $13 1 14
Certain gains and losses are allocated between assets sold during the year and assets still held at year-end
based on transactions and changes in valuations that occurred during the year. These allocations also impact our
calculation of net acquisitions and dispositions.
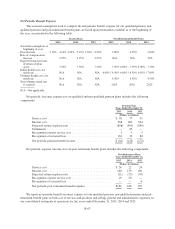
For the year ended December 31, 2015, the investment program produced actual losses on qualified pension
and post-retirement plan assets of $158 million as compared to expected returns of $919 million for a difference
of $1.077 billion. For the year ended December 31, 2014, the investment program produced actual gains on
pension and post-retirement plan assets of $1.410 billion as compared to the expected returns of $924 million for
a difference of $486 million. The short-term annual returns on plan assets will almost always be different from
the expected long-term returns and the plans could experience net gains or losses, due primarily to the volatility
occurring in the financial markets during any given year.
B-72