CenturyLink 2015 Annual Report Download - page 172
Download and view the complete annual report
Please find page 172 of the 2015 CenturyLink annual report below. You can navigate through the pages in the report by either clicking on the pages listed below, or by using the keyword search tool below to find specific information within the annual report.-
 1
1 -
2
-
3
-
4
-
5
-
6
-
7
-
8
-
9
-
10
-
11
-
12
-
13
-
14
-
15
-
16
-
17
-
18
-
19
-
20
-
21
-
22
-
23
-
24
-
25
-
26
-
27
-
28
-
29
-
30
-
31
-
32
-
33
-
34
-
35
-
36
-
37
-
38
-
39
-
40
-
41
-
42
-
43
-
44
-
45
-
46
-
47
-
48
-
49
-
50
-
51
-
52
-
53
-
54
-
55
-
56
-
57
-
58
-
59
-
60
-
61
-
62
-
63
-
64
-
65
-
66
-
67
-
68
-
69
-
70
-
71
-
72
-
73
-
74
-
75
-
76
-
77
-
78
-
79
-
80
-
81
-
82
-
83
-
84
-
85
-
86
-
87
-
88
-
89
-
90
-
91
-
92
-
93
-
94
-
95
-
96
-
97
-
98
-
99
-
100
-
101
-
102
-
103
-
104
-
105
-
106
-
107
-
108
-
109
-
110
-
111
-
112
-
113
-
114
-
115
-
116
-
117
-
118
-
119
-
120
-
121
-
122
-
123
-
124
-
125
-
126
-
127
-
128
-
129
-
130
-
131
-
132
-
133
-
134
-
135
-
136
-
137
-
138
-
139
-
140
-
141
-
142
-
143
-
144
-
145
-
146
-
147
-
148
-
149
-
150
-
151
-
152
-
153
-
154
-
155
-
156
-
157
-
158
-
159
-
160
-
161
-
 162
162 -
 163
163 -
 164
164 -
 165
165 -
 166
166 -
 167
167 -
 168
168 -
 169
169 -
 170
170 -
 171
171 -
 172
172 -
 173
173 -
 174
174 -
 175
175 -
 176
176 -
 177
177 -
 178
178 -
 179
179 -
 180
180 -
 181
181 -
 182
182 -
183
-
184
-
185
-
186
-
187
-
188
-
189
-
190
-
191
-
192
-
193
-
194
-
195
-
196
-
197
-
198
-
199
-
200
-
201
-
202
 |
 |

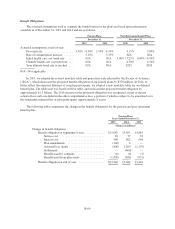
Benefit Obligations
The actuarial assumptions used to compute the funded status for the plans are based upon information
available as of December 31, 2015 and 2014 and are as follows:
Pension Plans Post-Retirement Benefit Plans
December 31, December 31,
2015 2014 2015 2014
Actuarial assumptions at end of year:
Discount rate .................... 3.50% - 4.50% 3.50% - 4.10% 4.15% 3.80%
Rate of compensation increase ...... 3.25% 3.25% N/A N/A
Initial health care cost trend rate ..... N/A N/A 5.00% / 5.25% 6.00% / 6.50%
Ultimate health care cost trend rate . . . N/A N/A 4.50% 4.50%
Year ultimate trend rate is reached . . . N/A N/A 2025 2024
N/A—Not applicable
In 2015, we adopted the revised mortality table and projection scale released by the Society of Actuaries
(“SOA”), which decreased the projected benefit obligation of our benefit plans by $379 million. In 2014, to
better reflect the expected lifetimes of our plan participants, we adopted a new mortality table for our defined
benefit plan. The table used was based on SOA tables and increased the projected benefit obligation by
approximately $1.3 billion. The 2014 increase in the projected obligation was recognized as part of the net
actuarial loss and is included in the other comprehensive loss, a portion of which is subject to be amortized over
the remaining estimated life of plan participants (approximately 8 years).
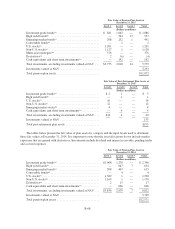
The following tables summarize the change in the benefit obligations for the pension and post-retirement
benefit plans:
Pension Plans
Years Ended December 31,
2015 2014 2013
(Dollars in millions)
Change in benefit obligation
Benefit obligation at beginning of year ............. $15,042 13,401 14,881
Service cost .............................. 83 77 91
Interest cost .............................. 568 602 544
Plan amendments .......................... (100) 4 —
Actuarial loss (gain) ........................ (800) 2,269 (1,179)
Settlements ............................... — (460) —
Benefits paid by company ................... (6) (6) (5)
Benefits paid from plan assets ................ (1,438) (845) (931)
Benefit obligation at end of year .................. $13,349 15,042 13,401
B-64