CenturyLink 2015 Annual Report Download - page 123
Download and view the complete annual report
Please find page 123 of the 2015 CenturyLink annual report below. You can navigate through the pages in the report by either clicking on the pages listed below, or by using the keyword search tool below to find specific information within the annual report.-
 1
1 -
2
-
3
-
4
-
5
-
6
-
7
-
8
-
9
-
10
-
11
-
12
-
13
-
14
-
15
-
16
-
17
-
18
-
19
-
20
-
21
-
22
-
23
-
24
-
25
-
26
-
27
-
28
-
29
-
30
-
31
-
32
-
33
-
34
-
35
-
36
-
37
-
38
-
39
-
40
-
41
-
42
-
43
-
44
-
45
-
46
-
47
-
48
-
49
-
50
-
51
-
52
-
53
-
54
-
55
-
56
-
57
-
58
-
59
-
60
-
61
-
62
-
63
-
64
-
65
-
66
-
67
-
68
-
69
-
70
-
71
-
72
-
73
-
74
-
75
-
76
-
77
-
78
-
79
-
80
-
81
-
82
-
83
-
84
-
85
-
86
-
87
-
88
-
89
-
90
-
91
-
92
-
93
-
94
-
95
-
96
-
97
-
98
-
99
-
100
-
101
-
102
-
103
-
104
-
105
-
106
-
107
-
108
-
109
-
110
-
111
-
112
-
 113
113 -
 114
114 -
 115
115 -
 116
116 -
 117
117 -
 118
118 -
 119
119 -
 120
120 -
 121
121 -
 122
122 -
 123
123 -
 124
124 -
 125
125 -
 126
126 -
 127
127 -
 128
128 -
 129
129 -
 130
130 -
 131
131 -
 132
132 -
 133
133 -
134
-
135
-
136
-
137
-
138
-
139
-
140
-
141
-
142
-
143
-
144
-
145
-
146
-
147
-
148
-
149
-
150
-
151
-
152
-
153
-
154
-
155
-
156
-
157
-
158
-
159
-
160
-
161
-
162
-
163
-
164
-
165
-
166
-
167
-
168
-
169
-
170
-
171
-
172
-
173
-
174
-
175
-
176
-
177
-
178
-
179
-
180
-
181
-
182
-
183
-
184
-
185
-
186
-
187
-
188
-
189
-
190
-
191
-
192
-
193
-
194
-
195
-
196
-
197
-
198
-
199
-
200
-
201
-
202
 |
 |

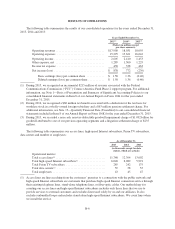
The following table reconciles our total segment revenues and total segment income presented above to
consolidated operating revenues and consolidated operating income reported in our consolidated statements of
operations.
Years Ended December 31,
2015 2014 2013
(Dollars in millions)
Total segment revenues ................................................ $16,668 17,028 17,095
Other operating revenues ............................................... 1,232 1,003 1,000
Operating revenues reported in our consolidated statements of operations ......... $17,900 18,031 18,095
Total segment income ................................................. $ 8,209 8,519 8,928
Other operating revenues ............................................... 1,232 1,003 1,000
Depreciation and amortization ........................................... (4,189) (4,428) (4,541)
Impairment of goodwill (Note 2) ......................................... — — (1,092)
Other unassigned operating expenses ..................................... (2,647) (2,684) (2,842)
Operating income reported in our consolidated statement of operations ........... $ 2,605 2,410 1,453
Allocation of Revenues and Expenses
Our segment revenues include all revenues from our strategic services, legacy services and data integration
as described in more detail above. Segment revenues are based upon each customer’s classification to an
individual segment. We report our segment revenues based upon all services provided to that segment’s
customers. For information on how we allocate expenses to our segments, as well as other additional information
about our segments, see Note 12—Segment Information to our consolidated financial statements in Item 8 of our
Annual Report on Form 10-K for the year ended December 31, 2015.
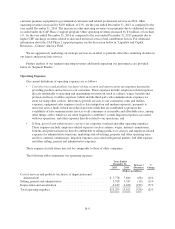
Business Segment
The operations of our business segment have been impacted by several significant trends, including those
described below:
•Strategic services. Our mix of total business segment revenues continues to migrate from legacy
services to strategic services as our small, medium and enterprise business, wholesale and
governmental customers increasingly demand integrated data, Internet, hosting and voice services.
During 2015, our strategic revenues were negatively impacted by several factors, including competitive
pressures, customer losses, migration from traditional hosting services to lower priced cloud-based
services and transitioning to our new management structure negatively impacted the growth of our
strategic revenues. Demand for our private line services (including special access) continues to decline
due to our customers’ optimization of their networks, industry consolidation and technological
migration to higher-speed services. Additionally, we face competition in Ethernet based services in the
wholesale market from cable companies and fiber based CLEC providers. We anticipate continued
pricing pressure for our colocation services as vendors continue to expand their enterprise colocation
operations. In recent years, our competitors, as well as several large, diversified technology companies,
have made substantial investments in cloud computing, which has intensified competitive pressures.
This expansion in competitive cloud computing offerings has led to increased pricing pressure and
competition for enterprise customers, and we expect these trends to continue. The demand for new
technology has also increased the number of competitors offering strategic services similar to ours.
Price compression from each of these above-mentioned competitive pressures has negatively impacted
the operating margins of our strategic services and we expect this trend to continue. Operating costs
also impact the operating margins of our strategic services, but to a lesser extent than price
compression and customer disconnects. These operating costs include sales commissions, modem
B-15