CenturyLink 2015 Annual Report Download - page 188
Download and view the complete annual report
Please find page 188 of the 2015 CenturyLink annual report below. You can navigate through the pages in the report by either clicking on the pages listed below, or by using the keyword search tool below to find specific information within the annual report.-
 1
1 -
2
-
3
-
4
-
5
-
6
-
7
-
8
-
9
-
10
-
11
-
12
-
13
-
14
-
15
-
16
-
17
-
18
-
19
-
20
-
21
-
22
-
23
-
24
-
25
-
26
-
27
-
28
-
29
-
30
-
31
-
32
-
33
-
34
-
35
-
36
-
37
-
38
-
39
-
40
-
41
-
42
-
43
-
44
-
45
-
46
-
47
-
48
-
49
-
50
-
51
-
52
-
53
-
54
-
55
-
56
-
57
-
58
-
59
-
60
-
61
-
62
-
63
-
64
-
65
-
66
-
67
-
68
-
69
-
70
-
71
-
72
-
73
-
74
-
75
-
76
-
77
-
78
-
79
-
80
-
81
-
82
-
83
-
84
-
85
-
86
-
87
-
88
-
89
-
90
-
91
-
92
-
93
-
94
-
95
-
96
-
97
-
98
-
99
-
100
-
101
-
102
-
103
-
104
-
105
-
106
-
107
-
108
-
109
-
110
-
111
-
112
-
113
-
114
-
115
-
116
-
117
-
118
-
119
-
120
-
121
-
122
-
123
-
124
-
125
-
126
-
127
-
128
-
129
-
130
-
131
-
132
-
133
-
134
-
135
-
136
-
137
-
138
-
139
-
140
-
141
-
142
-
143
-
144
-
145
-
146
-
147
-
148
-
149
-
150
-
151
-
152
-
153
-
154
-
155
-
156
-
157
-
158
-
159
-
160
-
161
-
162
-
163
-
164
-
165
-
166
-
167
-
168
-
169
-
170
-
171
-
172
-
173
-
174
-
175
-
176
-
177
-
 178
178 -
 179
179 -
 180
180 -
 181
181 -
 182
182 -
 183
183 -
 184
184 -
 185
185 -
 186
186 -
 187
187 -
 188
188 -
 189
189 -
 190
190 -
 191
191 -
 192
192 -
 193
193 -
 194
194 -
 195
195 -
 196
196 -
 197
197 -
 198
198 -
199
-
200
-
201
-
202
 |
 |

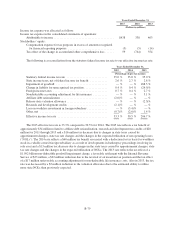
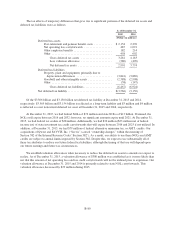
The tax effects of temporary differences that gave rise to significant portions of the deferred tax assets and
deferred tax liabilities were as follows:
As of December 31,
2015 2014
(Dollars in millions)
Deferred tax assets
Post-retirement and pension benefit costs ............ $2,154 2,276
Net operating loss carryforwards ................... 487 1,091
Other employee benefits .......................... 182 214
Other ......................................... 458 602
Gross deferred tax assets ..................... 3,281 4,183
Less valuation allowance ..................... (380) (409)
Net deferred tax assets ....................... 2,901 3,774
Deferred tax liabilities
Property, plant and equipment, primarily due to
depreciation differences ........................ (3,841) (3,869)
Goodwill and other intangible assets ................ (2,588) (2,908)
Other ......................................... (38) (147)
Gross deferred tax liabilities ................... (6,467) (6,924)
Net deferred tax liability .............................. $(3,566) (3,150)
Of the $3.566 billion and $3.150 billion net deferred tax liability at December 31, 2015 and 2014,
respectively, $3.569 billion and $3.154 billion is reflected as a long-term liability and $3 million and $4 million
is reflected as a net noncurrent deferred tax asset at December 31, 2015 and 2014, respectively.
At December 31, 2015, we had federal NOLs of $72 million and state NOLs of $13 billion. If unused, the
NOLs will expire between 2016 and 2032; however, no significant amounts expire until 2021. At December 31,
2015, we had federal tax credits of $28 million. Additionally, we had $36 million ($23 million net of federal
income tax) of state investment tax credit carryforwards that will expire between 2016 and 2025 if not utilized. In
addition, at December 31, 2015, we had $79 million of federal alternative minimum tax, or AMT, credits. Our
acquisitions of Qwest and SAVVIS, Inc. (“Savvis”) caused “ownership changes” within the meaning of
Section 382 of the Internal Revenue Code (“Section 382”). As a result, our ability to use these NOLs and AMT
credits are subject to annual limits imposed by Section 382. Despite this, we expect to use substantially all of
these tax attributes to reduce our future federal tax liabilities, although the timing of that use will depend upon
our future earnings and future tax circumstances.
We establish valuation allowances when necessary to reduce the deferred tax assets to amounts we expect to
realize. As of December 31, 2015, a valuation allowance of $380 million was established as it is more likely than
not that this amount of net operating loss and tax credit carryforwards will not be utilized prior to expiration. Our
valuation allowance at December 31, 2015 and 2014 is primarily related to state NOL carryforwards. This
valuation allowance decreased by $29 million during 2015.
B-80