CenturyLink 2015 Annual Report Download - page 57
Download and view the complete annual report
Please find page 57 of the 2015 CenturyLink annual report below. You can navigate through the pages in the report by either clicking on the pages listed below, or by using the keyword search tool below to find specific information within the annual report.-
 1
1 -
2
-
3
-
4
-
5
-
6
-
7
-
8
-
9
-
10
-
11
-
12
-
13
-
14
-
15
-
16
-
17
-
18
-
19
-
20
-
21
-
22
-
23
-
24
-
25
-
26
-
27
-
28
-
29
-
30
-
31
-
32
-
33
-
34
-
35
-
36
-
37
-
38
-
39
-
40
-
41
-
42
-
43
-
44
-
45
-
46
-
 47
47 -
 48
48 -
 49
49 -
 50
50 -
 51
51 -
 52
52 -
 53
53 -
 54
54 -
 55
55 -
 56
56 -
 57
57 -
 58
58 -
 59
59 -
 60
60 -
 61
61 -
 62
62 -
 63
63 -
 64
64 -
 65
65 -
 66
66 -
 67
67 -
68
-
69
-
70
-
71
-
72
-
73
-
74
-
75
-
76
-
77
-
78
-
79
-
80
-
81
-
82
-
83
-
84
-
85
-
86
-
87
-
88
-
89
-
90
-
91
-
92
-
93
-
94
-
95
-
96
-
97
-
98
-
99
-
100
-
101
-
102
-
103
-
104
-
105
-
106
-
107
-
108
-
109
-
110
-
111
-
112
-
113
-
114
-
115
-
116
-
117
-
118
-
119
-
120
-
121
-
122
-
123
-
124
-
125
-
126
-
127
-
128
-
129
-
130
-
131
-
132
-
133
-
134
-
135
-
136
-
137
-
138
-
139
-
140
-
141
-
142
-
143
-
144
-
145
-
146
-
147
-
148
-
149
-
150
-
151
-
152
-
153
-
154
-
155
-
156
-
157
-
158
-
159
-
160
-
161
-
162
-
163
-
164
-
165
-
166
-
167
-
168
-
169
-
170
-
171
-
172
-
173
-
174
-
175
-
176
-
177
-
178
-
179
-
180
-
181
-
182
-
183
-
184
-
185
-
186
-
187
-
188
-
189
-
190
-
191
-
192
-
193
-
194
-
195
-
196
-
197
-
198
-
199
-
200
-
201
-
202
 |
 |

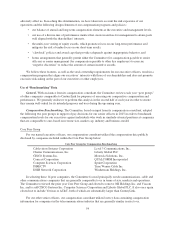
Recent Actions. In connection with establishing 2016 annual incentive bonus targets, the Committee made
no changes to our named executive officers’ bonus target percentages; however, the amount of Mr. Hussain’s
bonus target incrementally increased in proportion with his base salary increase.
Non-Executive Bonuses. We currently offer STI bonuses to all of our non-union and non-sales employees
and the STI thresholds, targets and maximum financial performance targets for our non-senior officers are the
same as the Committee approves for our senior officers. As discussed below under the heading “— Our
Compensation Decision-Making Process,” the CEO approves the performance goals of substantially all of the
non-senior officers under the general supervision of the Compensation Committee.
Long-Term Equity Incentive Compensation
General. Our shareholder-approved long-term incentive compensation programs authorize the
Compensation Committee to grant a variety of stock-based incentive awards to key personnel. We believe stock
incentive awards (i) encourage key personnel to focus on sustainable long-term performance, (ii) strengthen the
relationship between compensation and growth in the market price of the company’s common shares and thereby
align management’s financial interests with those of the shareholders and (iii) help attract and retain talented
personnel.
As it did in 2014, the Compensation Committee in 2015 granted 60% of our senior officers’ target equity
incentive compensation in the form of performance-based restricted stock, which is ultimately payable only if we
attain certain specified goals. The remaining portion of our senior officers’ long-term equity incentive
compensation awarded in 2014 and 2015 was paid in time-vested restricted stock, the value of which is
dependent on our performance over an extended vesting period.
In February 2016, we granted long-term equity incentive compensation awards to approximately 2% of our
non-executive employees in the form of time-vested restricted shares.
Performance Benchmarks. On an annual basis, the Committee reviews the relevance of our performance
benchmarks for alignment with our long-term strategic plan. In 2015, we kept the same two performance
benchmarks, relative TSR and absolute revenue, that we used for our 2014 performance-based restricted shares.
See further discussion under the heading “— Overview of Pay Elements and Linkage to Compensation
Philosophy and Objectives” in Subsection II above.
An overview of our TSR performance-based restricted shares granted in 2015 is outlined below.
• Performance Benchmark: Our percentile rank versus the below-described 26-company TSR peer
group. See further discussion under the heading “— Use of ‘Benchmarking’ Data — Performance
Benchmarking” in Subsection IV below.
•Performance Period: January 1, 2015 through December 31, 2017
• Performance Vesting: The ultimate number of TSR performance-based restricted shares that vest will
be based on our total shareholder return during the above-described performance period relative to the
total shareholder return of the TSR peer group over the same period, as illustrated in the table below.
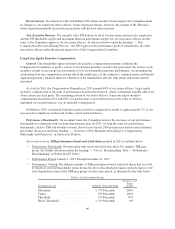
Relative Total Shareholder Return
Performance Level Company’s Percentile Rank
Payout as % of
Target
Award(1)
Maximum ......................... ≥75th Percentile 200%
Target ............................ 50
th Percentile 100%
Threshold ......................... 25
th Percentile 50%
Below Threshold ................... <25
th Percentile 0%
46