CenturyLink 2015 Annual Report Download - page 167
Download and view the complete annual report
Please find page 167 of the 2015 CenturyLink annual report below. You can navigate through the pages in the report by either clicking on the pages listed below, or by using the keyword search tool below to find specific information within the annual report.-
 1
1 -
2
-
3
-
4
-
5
-
6
-
7
-
8
-
9
-
10
-
11
-
12
-
13
-
14
-
15
-
16
-
17
-
18
-
19
-
20
-
21
-
22
-
23
-
24
-
25
-
26
-
27
-
28
-
29
-
30
-
31
-
32
-
33
-
34
-
35
-
36
-
37
-
38
-
39
-
40
-
41
-
42
-
43
-
44
-
45
-
46
-
47
-
48
-
49
-
50
-
51
-
52
-
53
-
54
-
55
-
56
-
57
-
58
-
59
-
60
-
61
-
62
-
63
-
64
-
65
-
66
-
67
-
68
-
69
-
70
-
71
-
72
-
73
-
74
-
75
-
76
-
77
-
78
-
79
-
80
-
81
-
82
-
83
-
84
-
85
-
86
-
87
-
88
-
89
-
90
-
91
-
92
-
93
-
94
-
95
-
96
-
97
-
98
-
99
-
100
-
101
-
102
-
103
-
104
-
105
-
106
-
107
-
108
-
109
-
110
-
111
-
112
-
113
-
114
-
115
-
116
-
117
-
118
-
119
-
120
-
121
-
122
-
123
-
124
-
125
-
126
-
127
-
128
-
129
-
130
-
131
-
132
-
133
-
134
-
135
-
136
-
137
-
138
-
139
-
140
-
141
-
142
-
143
-
144
-
145
-
146
-
147
-
148
-
149
-
150
-
151
-
152
-
153
-
154
-
155
-
156
-
 157
157 -
 158
158 -
 159
159 -
 160
160 -
 161
161 -
 162
162 -
 163
163 -
 164
164 -
 165
165 -
 166
166 -
 167
167 -
 168
168 -
 169
169 -
 170
170 -
 171
171 -
 172
172 -
 173
173 -
 174
174 -
 175
175 -
 176
176 -
 177
177 -
178
-
179
-
180
-
181
-
182
-
183
-
184
-
185
-
186
-
187
-
188
-
189
-
190
-
191
-
192
-
193
-
194
-
195
-
196
-
197
-
198
-
199
-
200
-
201
-
202
 |
 |

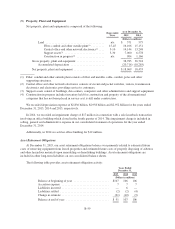
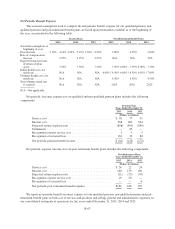
(5) Property, Plant and Equipment
Net property, plant and equipment is composed of the following:
Depreciable
Lives
As of December 31,
2015 2014
(Dollars in millions)
Land ........................................ n/a $ 571 575
Fiber, conduit and other outside plant(1) ......... 15-45 16,166 15,151
Central office and other network electronics(2) .... 3-10 14,144 13,248
Support assets(3) ........................... 3-30 7,000 6,578
Construction in progress(4) ................... n/a 904 1,166
Gross property, plant and equipment ................... 38,785 36,718
Accumulated depreciation ....................... (20,716) (18,285)
Net property, plant and equipment ..................... $18,069 18,433
(1) Fiber, conduit and other outside plant consists of fiber and metallic cable, conduit, poles and other
supporting structures.
(2) Central office and other network electronics consists of circuit and packet switches, routers, transmission
electronics and electronics providing service to customers.
(3) Support assets consist of buildings, data centers, computers and other administrative and support equipment.
(4) Construction in progress includes inventory held for construction and property of the aforementioned
categories that has not been placed in service as it is still under construction.
We recorded depreciation expense of $2.836 billion, $2.958 billion and $2.952 billion for the years ended
December 31, 2015, 2014 and 2013, respectively.
In 2014, we recorded an impairment charge of $17 million in connection with a sale-leaseback transaction
involving an office building which closed in the fourth quarter of 2014. This impairment charge is included in
selling, general and administrative expense in our consolidated statement of operations for the year ended
December 31, 2014.
Additionally, in 2014 we sold an office building for $12 million.
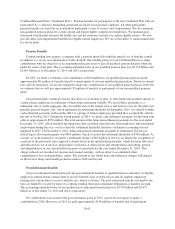
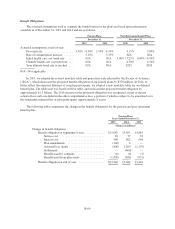
Asset Retirement Obligations
At December 31, 2015, our asset retirement obligations balance was primarily related to estimated future
costs of removing equipment from leased properties and estimated future costs of properly disposing of asbestos
and other hazardous materials upon remodeling or demolishing buildings. Asset retirement obligations are
included in other long-term liabilities on our consolidated balance sheets.
The following table provides asset retirement obligation activity:
Years Ended
December 31,
2015 2014 2013
(Dollars in millions)
Balance at beginning of year ........................ $107 106 106
Accretion expense ................................ 7 7 7
Liabilities incurred ................................ — 6 —
Liabilities settled ................................. (2) (2) (4)
Change in estimate ................................ (21) (10) (3)
Balance at end of year ............................. $ 91 107 106
B-59