CenturyLink 2015 Annual Report Download - page 173
Download and view the complete annual report
Please find page 173 of the 2015 CenturyLink annual report below. You can navigate through the pages in the report by either clicking on the pages listed below, or by using the keyword search tool below to find specific information within the annual report.-
 1
1 -
2
-
3
-
4
-
5
-
6
-
7
-
8
-
9
-
10
-
11
-
12
-
13
-
14
-
15
-
16
-
17
-
18
-
19
-
20
-
21
-
22
-
23
-
24
-
25
-
26
-
27
-
28
-
29
-
30
-
31
-
32
-
33
-
34
-
35
-
36
-
37
-
38
-
39
-
40
-
41
-
42
-
43
-
44
-
45
-
46
-
47
-
48
-
49
-
50
-
51
-
52
-
53
-
54
-
55
-
56
-
57
-
58
-
59
-
60
-
61
-
62
-
63
-
64
-
65
-
66
-
67
-
68
-
69
-
70
-
71
-
72
-
73
-
74
-
75
-
76
-
77
-
78
-
79
-
80
-
81
-
82
-
83
-
84
-
85
-
86
-
87
-
88
-
89
-
90
-
91
-
92
-
93
-
94
-
95
-
96
-
97
-
98
-
99
-
100
-
101
-
102
-
103
-
104
-
105
-
106
-
107
-
108
-
109
-
110
-
111
-
112
-
113
-
114
-
115
-
116
-
117
-
118
-
119
-
120
-
121
-
122
-
123
-
124
-
125
-
126
-
127
-
128
-
129
-
130
-
131
-
132
-
133
-
134
-
135
-
136
-
137
-
138
-
139
-
140
-
141
-
142
-
143
-
144
-
145
-
146
-
147
-
148
-
149
-
150
-
151
-
152
-
153
-
154
-
155
-
156
-
157
-
158
-
159
-
160
-
161
-
162
-
 163
163 -
 164
164 -
 165
165 -
 166
166 -
 167
167 -
 168
168 -
 169
169 -
 170
170 -
 171
171 -
 172
172 -
 173
173 -
 174
174 -
 175
175 -
 176
176 -
 177
177 -
 178
178 -
 179
179 -
 180
180 -
 181
181 -
 182
182 -
 183
183 -
184
-
185
-
186
-
187
-
188
-
189
-
190
-
191
-
192
-
193
-
194
-
195
-
196
-
197
-
198
-
199
-
200
-
201
-
202
 |
 |

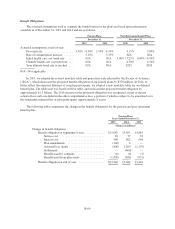
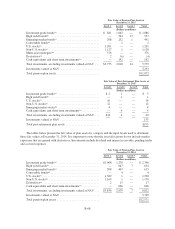
Post-Retirement Benefit Plans
Years Ended December 31,
2015 2014 2013
(Dollars in millions)
Change in benefit obligation
Benefit obligation at beginning of year ............... $3,830 3,688 4,075
Service cost ................................. 24 22 24
Interest cost ................................. 140 159 140
Participant contributions ....................... 57 69 96
Plan amendments ............................ — 23 141
Direct subsidy receipts ........................ 8 9 13
Actuarial loss (gain) .......................... (148) 245 (399)
Benefits paid by company ...................... (181) (166) (266)
Benefits paid from plan assets .................. (163) (219) (136)
Benefit obligation at end of year ..................... $3,567 3,830 3,688
Our aggregate benefit obligation as of December 31, 2015, 2014 and 2013 was $16.916 billion, $18.872
billion and $17.089 billion, respectively.
Plan Assets
We maintain plan assets for our qualified pension plan and certain post-retirement benefit plans. The
qualified pension plan’s assets are used for the payment of pension benefits and certain eligible plan expenses.
The post-retirement benefit plan’s assets are used to pay health care benefits and premiums on behalf of eligible
retirees and to pay certain eligible plan expenses. The expected rate of return on plan assets is the long-term rate
of return we expect to earn on the plans’ assets, net of administrative expenses paid from plan assets. The rate of
return is determined by the strategic allocation of plan assets and the long-term risk and return forecast for each
asset class. The forecasts for each asset class are generated primarily from an analysis of the long-term
expectations of various third party investment management organizations. The expected rate of return on plan
assets is reviewed annually and revised, as necessary, to reflect changes in the financial markets and our
investment strategy.
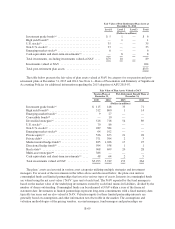
The following tables summarize the change in the fair value of plan assets for the pension and post-
retirement benefit plans:
Pension Plans
Years Ended December 31,
2015 2014 2013
(Dollars in millions)
Change in plan assets
Fair value of plan assets at beginning of year ........ $12,571 12,346 12,321
Return on plan assets ........................... (161) 1,373 810
Employer contributions ......................... 100 157 146
Settlements ................................... — (460) —
Benefits paid from plan assets .................... (1,438) (845) (931)
Fair value of plan assets at end of year ................. $11,072 12,571 12,346
B-65