CenturyLink 2015 Annual Report Download - page 110
Download and view the complete annual report
Please find page 110 of the 2015 CenturyLink annual report below. You can navigate through the pages in the report by either clicking on the pages listed below, or by using the keyword search tool below to find specific information within the annual report.-
 1
1 -
2
-
3
-
4
-
5
-
6
-
7
-
8
-
9
-
10
-
11
-
12
-
13
-
14
-
15
-
16
-
17
-
18
-
19
-
20
-
21
-
22
-
23
-
24
-
25
-
26
-
27
-
28
-
29
-
30
-
31
-
32
-
33
-
34
-
35
-
36
-
37
-
38
-
39
-
40
-
41
-
42
-
43
-
44
-
45
-
46
-
47
-
48
-
49
-
50
-
51
-
52
-
53
-
54
-
55
-
56
-
57
-
58
-
59
-
60
-
61
-
62
-
63
-
64
-
65
-
66
-
67
-
68
-
69
-
70
-
71
-
72
-
73
-
74
-
75
-
76
-
77
-
78
-
79
-
80
-
81
-
82
-
83
-
84
-
85
-
86
-
87
-
88
-
89
-
90
-
91
-
92
-
93
-
94
-
95
-
96
-
97
-
98
-
99
-
 100
100 -
 101
101 -
 102
102 -
 103
103 -
 104
104 -
 105
105 -
 106
106 -
 107
107 -
 108
108 -
 109
109 -
 110
110 -
 111
111 -
 112
112 -
 113
113 -
 114
114 -
 115
115 -
 116
116 -
 117
117 -
 118
118 -
 119
119 -
 120
120 -
121
-
122
-
123
-
124
-
125
-
126
-
127
-
128
-
129
-
130
-
131
-
132
-
133
-
134
-
135
-
136
-
137
-
138
-
139
-
140
-
141
-
142
-
143
-
144
-
145
-
146
-
147
-
148
-
149
-
150
-
151
-
152
-
153
-
154
-
155
-
156
-
157
-
158
-
159
-
160
-
161
-
162
-
163
-
164
-
165
-
166
-
167
-
168
-
169
-
170
-
171
-
172
-
173
-
174
-
175
-
176
-
177
-
178
-
179
-
180
-
181
-
182
-
183
-
184
-
185
-
186
-
187
-
188
-
189
-
190
-
191
-
192
-
193
-
194
-
195
-
196
-
197
-
198
-
199
-
200
-
201
-
202
 |
 |

SELECTED FINANCIAL DATA
The following tables of selected consolidated financial data should be read in conjunction with, and are
qualified by reference to, our consolidated financial statements and notes thereto in Item 8 and “Management’s
Discussion and Analysis of Financial Condition and Results of Operations” in Item 7 of our Annual Report on
Form 10-K for the year ended December 31, 2015.
The tables of selected financial data shown below are derived from our audited consolidated financial
statements. These historical results are not necessarily indicative of results that you can expect for any future
period.
The results of operations include Savvis for periods after July 15, 2011 and Qwest for periods after April 1,
2011.
Selected financial information from our consolidated statements of operations is as follows:
Years Ended December 31,(1)
2015(2) 2014(3) 2013(4) 2012 2011
(Dollars in millions, except per share amounts
and shares in thousands)
Operating revenues ................................ $ 17,900 18,031 18,095 18,376 15,351
Operating expenses ............................... 15,295 15,621 16,642 15,663 13,326
Operating income ................................. $ 2,605 2,410 1,453 2,713 2,025
Income before income tax expense ................... 1,316 1,110 224 1,250 948
Net income (loss) ................................. 878 772 (239) 777 573
Basic earnings (loss) per common share ............... 1.58 1.36 (0.40) 1.25 1.07
Diluted earnings (loss) per common share .............. 1.58 1.36 (0.40) 1.25 1.07
Dividends declared per common share ................ 2.16 2.16 2.16 2.90 2.90
Weighted average basic common shares outstanding ..... 554,278 568,435 600,892 620,205 532,780
Weighted average diluted common shares outstanding .... 555,093 569,739 600,892 622,285 534,121
(1) See “Management’s Discussion and Analysis of Financial Condition and Results of Operations—Results of
Operations” in Item 7 our Annual Report on Form 10-K for the year ended December 31, 2015 for a
discussion of unusual items affecting the results for the years ended December 31, 2015, 2014 and 2013.
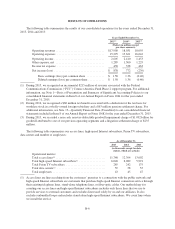
(2) During 2015, we recognized an incremental $215 million of revenue associated with the Federal
Communications Commission (“FCC”) Connect America Fund Phase 2 support program. For additional
information, see Note 1—Basis of Presentation and Summary of Significant Accounting Policies to our
consolidated financial statements in Item 8 of our Annual Report on Form 10-K for the year ended
December 31, 2015.
(3) During 2014, we recognized a $60 million tax benefit associated with a deduction for the tax basis for
worthless stock in a wholly-owned foreign subsidiary and a $63 million pension settlement charge. For
additional information, see Note 13—Quarterly Financial Data (Unaudited) to our consolidated financial
statements included in Item 8 of our Annual Report on Form 10-K for the year ended December 31, 2015.
(4) During 2013, we recorded a non-cash, non-tax-deductible goodwill impairment charge of $1.092 billion for
goodwill attributed to one of our previous operating segments and a litigation settlement charge of $235
million.
B-2