CenturyLink 2015 Annual Report Download - page 122
Download and view the complete annual report
Please find page 122 of the 2015 CenturyLink annual report below. You can navigate through the pages in the report by either clicking on the pages listed below, or by using the keyword search tool below to find specific information within the annual report.-
 1
1 -
2
-
3
-
4
-
5
-
6
-
7
-
8
-
9
-
10
-
11
-
12
-
13
-
14
-
15
-
16
-
17
-
18
-
19
-
20
-
21
-
22
-
23
-
24
-
25
-
26
-
27
-
28
-
29
-
30
-
31
-
32
-
33
-
34
-
35
-
36
-
37
-
38
-
39
-
40
-
41
-
42
-
43
-
44
-
45
-
46
-
47
-
48
-
49
-
50
-
51
-
52
-
53
-
54
-
55
-
56
-
57
-
58
-
59
-
60
-
61
-
62
-
63
-
64
-
65
-
66
-
67
-
68
-
69
-
70
-
71
-
72
-
73
-
74
-
75
-
76
-
77
-
78
-
79
-
80
-
81
-
82
-
83
-
84
-
85
-
86
-
87
-
88
-
89
-
90
-
91
-
92
-
93
-
94
-
95
-
96
-
97
-
98
-
99
-
100
-
101
-
102
-
103
-
104
-
105
-
106
-
107
-
108
-
109
-
110
-
111
-
 112
112 -
 113
113 -
 114
114 -
 115
115 -
 116
116 -
 117
117 -
 118
118 -
 119
119 -
 120
120 -
 121
121 -
 122
122 -
 123
123 -
 124
124 -
 125
125 -
 126
126 -
 127
127 -
 128
128 -
 129
129 -
 130
130 -
 131
131 -
 132
132 -
133
-
134
-
135
-
136
-
137
-
138
-
139
-
140
-
141
-
142
-
143
-
144
-
145
-
146
-
147
-
148
-
149
-
150
-
151
-
152
-
153
-
154
-
155
-
156
-
157
-
158
-
159
-
160
-
161
-
162
-
163
-
164
-
165
-
166
-
167
-
168
-
169
-
170
-
171
-
172
-
173
-
174
-
175
-
176
-
177
-
178
-
179
-
180
-
181
-
182
-
183
-
184
-
185
-
186
-
187
-
188
-
189
-
190
-
191
-
192
-
193
-
194
-
195
-
196
-
197
-
198
-
199
-
200
-
201
-
202
 |
 |

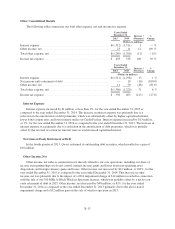
Income Tax Expense
Income tax expense increased by $100 million for the year ended December 31, 2015 as compared to the
year ended December 31, 2014. Our income tax expense for the year ended December 31, 2014 decreased by
$125 million from the amounts for the comparable prior year. For the years ended December 31, 2015, 2014 and
2013, our effective income tax rate was 33.3%, 30.5% and 206.7%, respectively. The effective tax rate for the
year ended December 31, 2015, reflects a tax benefit of approximately $34 million related to affiliate debt
rationalization, research and development tax credits of $28 million for 2011 through 2015, and a $16 million tax
decrease due to changes in state taxes caused by apportionment changes, state tax rate changes and the changes in
the expected utilization of net operating losses (“NOLs”). The effective tax rate for the year ended December 31,
2014, reflects a $60 million tax benefit associated with a worthless stock deduction for the tax basis in a wholly-
owned foreign subsidiary as a result of developments in bankruptcy proceedings involving its sole asset, an
indirect investment in KPNQwest, N.V. The subsidiary was acquired as part of the acquisition of Qwest and we
assigned it no fair value in the acquisition due to the bankruptcy proceedings, which were then ongoing. The
effective tax rate for the year ended December 31, 2014 also reflects a $13 million tax decrease due to changes in
state taxes caused by apportionment changes, state tax rate changes and the changes in the expected utilization of
NOLs. The rate also reflects the absence of tax benefits from the impairment and disposition of our 700 MHz A-
Block wireless spectrum licenses in 2014, because we are not likely to generate income of a character required to
realize a tax benefit from the loss on disposition during the period permitted by law for utilization of that loss.
The 2013 effective tax rate reflects the impacts of the $1.092 billion non-deductible goodwill impairment and of
an unfavorable accounting adjustment of $17 million related to non-deductible life insurance costs. The 2013 tax
expense also includes the impacts of a favorable settlement with the Internal Revenue Service (“IRS”) of $33
million and a favorable adjustment of $22 million related to the reversal of liabilities for uncertain tax positions.
See Note 11—Income Taxes to our consolidated financial statements in Item 8 of our Annual Report on Form
10-K for the year ended December 31, 2015 and “Critical Accounting Policies and Estimates—Income Taxes”
below for additional information.
Segment Results
The results for our business and consumer segments are summarized below for the years ended
December 31, 2015, 2014 and 2013:
Years Ended December 31,
2015 2014 2013
(Dollars in millions)
Total segment revenues ............................. $16,668 17,028 17,095
Total segment expenses ............................. 8,459 8,509 8,167
Total segment income .............................. $ 8,209 8,519 8,928
Total margin percentage ............................. 49% 50% 52%
Business segment:
Revenues .................................... $10,647 11,034 11,091
Expenses ..................................... 6,034 6,089 5,808
Income ...................................... $ 4,613 4,945 5,283
Margin percentage ............................. 43% 45% 48%
Consumer segment:
Revenues .................................... $ 6,021 5,994 6,004
Expenses ..................................... 2,425 2,420 2,359
Income ...................................... $ 3,596 3,574 3,645
Margin percentage ............................. 60% 60% 61%
B-14