CenturyLink 2015 Annual Report Download - page 175
Download and view the complete annual report
Please find page 175 of the 2015 CenturyLink annual report below. You can navigate through the pages in the report by either clicking on the pages listed below, or by using the keyword search tool below to find specific information within the annual report.-
 1
1 -
2
-
3
-
4
-
5
-
6
-
7
-
8
-
9
-
10
-
11
-
12
-
13
-
14
-
15
-
16
-
17
-
18
-
19
-
20
-
21
-
22
-
23
-
24
-
25
-
26
-
27
-
28
-
29
-
30
-
31
-
32
-
33
-
34
-
35
-
36
-
37
-
38
-
39
-
40
-
41
-
42
-
43
-
44
-
45
-
46
-
47
-
48
-
49
-
50
-
51
-
52
-
53
-
54
-
55
-
56
-
57
-
58
-
59
-
60
-
61
-
62
-
63
-
64
-
65
-
66
-
67
-
68
-
69
-
70
-
71
-
72
-
73
-
74
-
75
-
76
-
77
-
78
-
79
-
80
-
81
-
82
-
83
-
84
-
85
-
86
-
87
-
88
-
89
-
90
-
91
-
92
-
93
-
94
-
95
-
96
-
97
-
98
-
99
-
100
-
101
-
102
-
103
-
104
-
105
-
106
-
107
-
108
-
109
-
110
-
111
-
112
-
113
-
114
-
115
-
116
-
117
-
118
-
119
-
120
-
121
-
122
-
123
-
124
-
125
-
126
-
127
-
128
-
129
-
130
-
131
-
132
-
133
-
134
-
135
-
136
-
137
-
138
-
139
-
140
-
141
-
142
-
143
-
144
-
145
-
146
-
147
-
148
-
149
-
150
-
151
-
152
-
153
-
154
-
155
-
156
-
157
-
158
-
159
-
160
-
161
-
162
-
163
-
164
-
 165
165 -
 166
166 -
 167
167 -
 168
168 -
 169
169 -
 170
170 -
 171
171 -
 172
172 -
 173
173 -
 174
174 -
 175
175 -
 176
176 -
 177
177 -
 178
178 -
 179
179 -
 180
180 -
 181
181 -
 182
182 -
 183
183 -
 184
184 -
 185
185 -
186
-
187
-
188
-
189
-
190
-
191
-
192
-
193
-
194
-
195
-
196
-
197
-
198
-
199
-
200
-
201
-
202
 |
 |

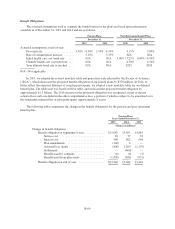
Derivative instruments: Derivative instruments are used to reduce risk as well as provide return. The
pension and post-retirement benefit plans use exchange traded futures and swaps to gain exposure to equity and
interest rate markets consistent with target asset allocations and to reduce risk relative to measurement of the
benefit obligation, which is sensitive to interest rate changes. Foreign exchange forward contracts are used to
manage currency exposures. Credit default swaps are used to manage credit risk exposures in a cost effective and
targeted manner relative to transacting with physical corporate fixed income securities. Options are currently
used to manage interest rate exposure taking into account the implied volatility and current pricing of the specific
underlying market instrument. Some derivative instruments subject the plans to counterparty risk. The external
investment managers, along with Plan Management, monitor counterparty exposure and mitigate this risk by
diversifying the exposure among multiple high credit quality counterparties, requiring collateral and limiting
exposure by periodically settling contracts.
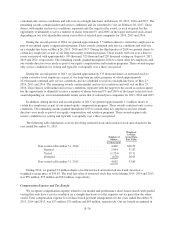
The gross notional exposure of the derivative instruments directly held by the plans is shown below. The
notional amount of the derivatives corresponds to market exposure but does not represent an actual cash
investment.
Gross Notional Exposure
Pension Plans
Post-Retirement
Benefit Plans
Years Ended December 31,
2015 2014 2015 2014
(Dollars in millions)
Derivative instruments:
Exchange-traded U.S. equity futures ....................... $ 79 134 — 7
Exchange-traded Treasury and other interest rate futures ....... 1,767 2,451 — —
Interest rate swaps ...................................... 550 579 — —
Credit default swaps .................................... 189 382 — —
Foreign exchange forwards ............................... 992 1,195 — 13
Options .............................................. 285 529 — —
Fair Value Measurements: Fair value is defined as the price that would be received to sell an asset or paid to
transfer a liability in an orderly transaction between independent and knowledgeable parties who are willing and
able to transact for an asset or liability at the measurement date. We use valuation techniques that maximize the
use of observable inputs and minimize the use of unobservable inputs when determining fair value and then we
rank the estimated values based on the reliability of the inputs used following the fair value hierarchy set forth by
the FASB. For additional information on the fair value hierarchy, see Note 10—Fair Value Disclosure.
At December 31, 2015, we used the following valuation techniques to measure fair value for assets. There
were no changes to these methodologies during 2015:
• Level 1—Assets were valued using the closing price reported in the active market in which the
individual security was traded.
• Level 2—Assets were valued using quoted prices in markets that are not active, broker dealer
quotations, net asset value of shares held by the plans and other methods by which all significant inputs
were observable at the measurement date.
• Level 3—Assets were valued using unobservable inputs in which little or no market data exists as
reported by the respective institutions at the measurement date.
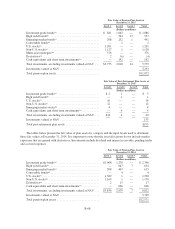
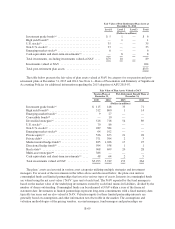
The tables below present the fair value of plan assets by category and the input levels used to determine
those fair values at December 31, 2015. It is important to note that the asset allocations do not include market
exposures that are gained with derivatives. Investments include dividend and interest receivables, pending trades
and accrued expenses.
B-67