CenturyLink 2015 Annual Report Download - page 143
Download and view the complete annual report
Please find page 143 of the 2015 CenturyLink annual report below. You can navigate through the pages in the report by either clicking on the pages listed below, or by using the keyword search tool below to find specific information within the annual report.-
 1
1 -
2
-
3
-
4
-
5
-
6
-
7
-
8
-
9
-
10
-
11
-
12
-
13
-
14
-
15
-
16
-
17
-
18
-
19
-
20
-
21
-
22
-
23
-
24
-
25
-
26
-
27
-
28
-
29
-
30
-
31
-
32
-
33
-
34
-
35
-
36
-
37
-
38
-
39
-
40
-
41
-
42
-
43
-
44
-
45
-
46
-
47
-
48
-
49
-
50
-
51
-
52
-
53
-
54
-
55
-
56
-
57
-
58
-
59
-
60
-
61
-
62
-
63
-
64
-
65
-
66
-
67
-
68
-
69
-
70
-
71
-
72
-
73
-
74
-
75
-
76
-
77
-
78
-
79
-
80
-
81
-
82
-
83
-
84
-
85
-
86
-
87
-
88
-
89
-
90
-
91
-
92
-
93
-
94
-
95
-
96
-
97
-
98
-
99
-
100
-
101
-
102
-
103
-
104
-
105
-
106
-
107
-
108
-
109
-
110
-
111
-
112
-
113
-
114
-
115
-
116
-
117
-
118
-
119
-
120
-
121
-
122
-
123
-
124
-
125
-
126
-
127
-
128
-
129
-
130
-
131
-
132
-
 133
133 -
 134
134 -
 135
135 -
 136
136 -
 137
137 -
 138
138 -
 139
139 -
 140
140 -
 141
141 -
 142
142 -
 143
143 -
 144
144 -
 145
145 -
 146
146 -
 147
147 -
 148
148 -
 149
149 -
 150
150 -
 151
151 -
 152
152 -
 153
153 -
154
-
155
-
156
-
157
-
158
-
159
-
160
-
161
-
162
-
163
-
164
-
165
-
166
-
167
-
168
-
169
-
170
-
171
-
172
-
173
-
174
-
175
-
176
-
177
-
178
-
179
-
180
-
181
-
182
-
183
-
184
-
185
-
186
-
187
-
188
-
189
-
190
-
191
-
192
-
193
-
194
-
195
-
196
-
197
-
198
-
199
-
200
-
201
-
202
 |
 |

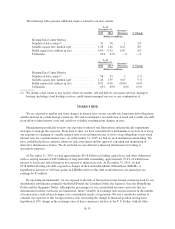
The following tables present additional metrics related to our data centers:
As of
December 31, Increase /
(Decrease) % Change2015 2014
(Dollars in millions)
Hosting Data Center Metrics
Number of data centers(1) ..................... 59 58 1 2%
Sellable square feet, million sq ft ............... 1.58 1.46 0.12 8%
Billed square feet, million sq feet ............... 0.99 0.92 0.07 8%
Utilization ................................. 63% 63% —% —%
As of
December 31, Increase /
(Decrease) % Change2014 2013
(Dollars in millions)
Hosting Data Center Metrics
Number of data centers(1) ..................... 58 55 3 5%
Sellable square feet, million sq ft ............... 1.46 1.39 0.07 5 %
Billed square feet, million sq feet ............... 0.92 0.96 (0.04) (4)%
Utilization ................................. 63% 69% (6)% (9)%
(1) We define a data center as any facility where we market, sell and deliver colocation services, managed
hosting (including cloud hosting) services, multi-tenant managed services or any combination of.
MARKET RISK
We are exposed to market risk from changes in interest rates on our variable rate long-term debt obligations
and fluctuations in certain foreign currencies. We seek to maintain a favorable mix of fixed and variable rate debt
in an effort to limit interest costs and cash flow volatility resulting from changes in rates.
Management periodically reviews our exposure to interest rate fluctuations and periodically implements
strategies to manage the exposure. From time to time, we have used derivative instruments to (i) lock-in or swap
our exposure to changing or variable interest rates for fixed interest rates or (ii) to swap obligations to pay fixed
interest rates for variable interest rates. As of December 31, 2015, we had no such instruments outstanding. We
have established policies and procedures for risk assessment and the approval, reporting and monitoring of
derivative instrument activities. We do not hold or issue derivative financial instruments for trading or
speculative purposes.
At December 31, 2015, we had approximately $19.8 billion (excluding capital lease and other obligations
with a carrying amount of $425 million) of long-term debt outstanding, approximately 95.6% of which bears
interest at fixed rates and is therefore not exposed to interest rate risk. At December 31, 2015, we had
$738 million floating rate debt exposed to changes in the London InterBank Offered Rate (LIBOR). A
hypothetical increase of 100 basis points in LIBOR relative to this debt would decrease our annual pre-tax
earnings by $7 million.
By operating internationally, we are exposed to the risk of fluctuations in the foreign currencies used by our
international subsidiaries, primarily the British Pound, the Canadian Dollar, the Japanese Yen, the Hong Kong
Dollar and the Singapore Dollar. Although the percentages of our consolidated revenues and costs that are
denominated in these currencies are immaterial, future volatility in exchange rates and an increase in the number
of transactions could adversely impact our consolidated results of operations. We use a sensitivity analysis to
estimate our exposure to this foreign currency risk, measuring the change in financial position arising from
hypothetical 10% change in the exchange rates of these currencies, relative to the U.S. Dollar, with all other
B-35