CenturyLink 2015 Annual Report Download - page 125
Download and view the complete annual report
Please find page 125 of the 2015 CenturyLink annual report below. You can navigate through the pages in the report by either clicking on the pages listed below, or by using the keyword search tool below to find specific information within the annual report.-
 1
1 -
2
-
3
-
4
-
5
-
6
-
7
-
8
-
9
-
10
-
11
-
12
-
13
-
14
-
15
-
16
-
17
-
18
-
19
-
20
-
21
-
22
-
23
-
24
-
25
-
26
-
27
-
28
-
29
-
30
-
31
-
32
-
33
-
34
-
35
-
36
-
37
-
38
-
39
-
40
-
41
-
42
-
43
-
44
-
45
-
46
-
47
-
48
-
49
-
50
-
51
-
52
-
53
-
54
-
55
-
56
-
57
-
58
-
59
-
60
-
61
-
62
-
63
-
64
-
65
-
66
-
67
-
68
-
69
-
70
-
71
-
72
-
73
-
74
-
75
-
76
-
77
-
78
-
79
-
80
-
81
-
82
-
83
-
84
-
85
-
86
-
87
-
88
-
89
-
90
-
91
-
92
-
93
-
94
-
95
-
96
-
97
-
98
-
99
-
100
-
101
-
102
-
103
-
104
-
105
-
106
-
107
-
108
-
109
-
110
-
111
-
112
-
113
-
114
-
 115
115 -
 116
116 -
 117
117 -
 118
118 -
 119
119 -
 120
120 -
 121
121 -
 122
122 -
 123
123 -
 124
124 -
 125
125 -
 126
126 -
 127
127 -
 128
128 -
 129
129 -
 130
130 -
 131
131 -
 132
132 -
 133
133 -
 134
134 -
 135
135 -
136
-
137
-
138
-
139
-
140
-
141
-
142
-
143
-
144
-
145
-
146
-
147
-
148
-
149
-
150
-
151
-
152
-
153
-
154
-
155
-
156
-
157
-
158
-
159
-
160
-
161
-
162
-
163
-
164
-
165
-
166
-
167
-
168
-
169
-
170
-
171
-
172
-
173
-
174
-
175
-
176
-
177
-
178
-
179
-
180
-
181
-
182
-
183
-
184
-
185
-
186
-
187
-
188
-
189
-
190
-
191
-
192
-
193
-
194
-
195
-
196
-
197
-
198
-
199
-
200
-
201
-
202
 |
 |

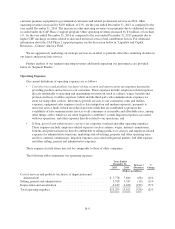
The following tables summarize the results of operations from our business segment:
Business Segment
Years Ended
December 31, Increase /
(Decrease)
%
Change2015 2014
(Dollars in millions)
Segment revenues:
Strategic services
High-bandwidth data services(1) ......................... $ 2,816 2,579 237 9 %
Low-bandwidth data services(2) ......................... 2,052 2,345 (293) (12)%
Hosting services(3) ................................... 1,281 1,316 (35) (3)%
Other strategic services(4) .............................. 162 76 86 113%
Total strategic services revenues .................... 6,311 6,316 (5) — %
Legacy services
Voice services(5) ..................................... 2,590 2,780 (190) (7)%
Other legacy services(6) ................................ 1,175 1,252 (77) (6)%
Total legacy services revenues .......................... 3,765 4,032 (267) (7)%
Data integration ......................................... 571 686 (115) (17)%
Total revenues .......................................... 10,647 11,034 (387) (4)%
Segment expenses:
Total expenses .......................................... 6,034 6,089 (55) (1)%
Segment income ............................................. $ 4,613 4,945 (332) (7)%
Segment margin percentage .................................... 43% 45%
Business Segment
Years Ended
December 31, Increase /
(Decrease)
%
Change2014 2013
(Dollars in millions)
Segment revenues:
Strategic services
High-bandwidth data services(1) ......................... $ 2,579 2,230 349 16 %
Low-bandwidth data services(2) ......................... 2,345 2,577 (232) (9)%
Hosting services(3) ................................... 1,316 1,259 57 5 %
Other strategic services(4) .............................. 76 60 16 27%
Total strategic services revenues .................... 6,316 6,126 190 3 %
Legacy services
Voice services(5) ..................................... 2,780 2,916 (136) (5)%
Other legacy services(6) 1,252 1,398 (146) (10)%
Total legacy services revenues .......................... 4,032 4,314 (282) (7)%
Data integration ......................................... 686 651 35 5%
Total revenues .......................................... 11,034 11,091 (57) (1)%
Segment expenses:
Total expenses .......................................... 6,089 5,808 281 5 %
Segment income ............................................. $ 4,945 5,283 (338) (6)%
Segment margin percentage .................................... 45% 48%
B-17