CenturyLink 2015 Annual Report Download - page 176
Download and view the complete annual report
Please find page 176 of the 2015 CenturyLink annual report below. You can navigate through the pages in the report by either clicking on the pages listed below, or by using the keyword search tool below to find specific information within the annual report.-
 1
1 -
2
-
3
-
4
-
5
-
6
-
7
-
8
-
9
-
10
-
11
-
12
-
13
-
14
-
15
-
16
-
17
-
18
-
19
-
20
-
21
-
22
-
23
-
24
-
25
-
26
-
27
-
28
-
29
-
30
-
31
-
32
-
33
-
34
-
35
-
36
-
37
-
38
-
39
-
40
-
41
-
42
-
43
-
44
-
45
-
46
-
47
-
48
-
49
-
50
-
51
-
52
-
53
-
54
-
55
-
56
-
57
-
58
-
59
-
60
-
61
-
62
-
63
-
64
-
65
-
66
-
67
-
68
-
69
-
70
-
71
-
72
-
73
-
74
-
75
-
76
-
77
-
78
-
79
-
80
-
81
-
82
-
83
-
84
-
85
-
86
-
87
-
88
-
89
-
90
-
91
-
92
-
93
-
94
-
95
-
96
-
97
-
98
-
99
-
100
-
101
-
102
-
103
-
104
-
105
-
106
-
107
-
108
-
109
-
110
-
111
-
112
-
113
-
114
-
115
-
116
-
117
-
118
-
119
-
120
-
121
-
122
-
123
-
124
-
125
-
126
-
127
-
128
-
129
-
130
-
131
-
132
-
133
-
134
-
135
-
136
-
137
-
138
-
139
-
140
-
141
-
142
-
143
-
144
-
145
-
146
-
147
-
148
-
149
-
150
-
151
-
152
-
153
-
154
-
155
-
156
-
157
-
158
-
159
-
160
-
161
-
162
-
163
-
164
-
165
-
 166
166 -
 167
167 -
 168
168 -
 169
169 -
 170
170 -
 171
171 -
 172
172 -
 173
173 -
 174
174 -
 175
175 -
 176
176 -
 177
177 -
 178
178 -
 179
179 -
 180
180 -
 181
181 -
 182
182 -
 183
183 -
 184
184 -
 185
185 -
 186
186 -
187
-
188
-
189
-
190
-
191
-
192
-
193
-
194
-
195
-
196
-
197
-
198
-
199
-
200
-
201
-
202
 |
 |

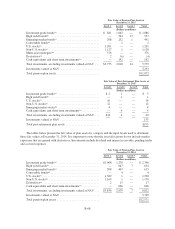
Fair Value of Pension Plan Assets at
December 31, 2015
Level 1 Level 2 Level 3 Total
(Dollars in millions)
Investment grade bonds(a) ............................ $ 841 1,045 — $ 1,886
High yield bonds(b) .................................. — 544 13 557
Emerging market bonds(c) ............................ 208 232 1 441
Convertible bonds(d) ................................. — 2 — 2
U.S. stocks(f) ...................................... 1,201 — — 1,201
Non-U.S. stocks(g) .................................. 1,127 1 — 1,128
Multi-asset strategies(m) .............................. 376 — — 376
Derivatives(n) ...................................... 2 (6) — (4)
Cash equivalents and short-term investments(o) ........... — 192 — 192
Total investments, excluding investments valued at NAV . . . $3,755 2,010 14 5,779
Investments valued at NAV ........................... 5,293
Total pension plan assets ............................. $11,072
Fair Value of Post-Retirement Plan Assets at
December 31, 2015
Level 1 Level 2 Level 3 Total
(Dollars in millions)
Investment grade bonds(a) ............................ $ 2 1 — $ 3
High yield bonds(b) .................................. — 1 — 1
U.S. stocks(f) ....................................... 16 — — 16
Non-U.S. stocks(g) .................................. 12 — — 12
Emerging market stocks(h) ............................ 4 — — 4
Cash equivalents and short-term investments(o) ............ — 4 — 4
Total investments, excluding investments valued at NAV . . . $34 6 — 40
Investments valued at NAV ........................... 153
Total post-retirement plan assets ....................... $193
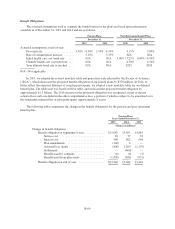
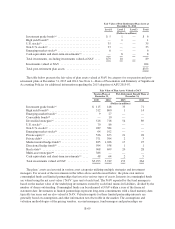
The tables below present the fair value of plan assets by category and the input levels used to determine
those fair values at December 31, 2014. It is important to note that the asset allocations do not include market
exposures that are gained with derivatives. Investments include dividend and interest receivable, pending trades
and accrued expenses.
Fair Value of Pension Plan Assets at
December 31, 2014
Level 1 Level 2 Level 3 Total
(Dollars in millions)
Investment grade bonds(a) ............................ $1,068 1,278 — $ 2,346
High yield bonds(b) .................................. — 647 7 654
Emerging market bonds(c) ............................ 208 407 — 615
Convertible bonds(d) ................................. — 4 — 4
U.S. stocks(f) ...................................... 1,389 1 — 1,390
Non-U.S. stocks(g) .................................. 1,169 1 — 1,170
Derivatives(n) ...................................... 2 15 — 17
Cash equivalents and short-term investments(o) ........... — 626 — 626
Total investments, excluding investments valued at NAV . . . $3,836 2,979 7 6,822
Investments valued at NAV ........................... 5,749
Total pension plan assets ............................. $12,571
B-68