CenturyLink 2015 Annual Report Download - page 58
Download and view the complete annual report
Please find page 58 of the 2015 CenturyLink annual report below. You can navigate through the pages in the report by either clicking on the pages listed below, or by using the keyword search tool below to find specific information within the annual report.-
 1
1 -
2
-
3
-
4
-
5
-
6
-
7
-
8
-
9
-
10
-
11
-
12
-
13
-
14
-
15
-
16
-
17
-
18
-
19
-
20
-
21
-
22
-
23
-
24
-
25
-
26
-
27
-
28
-
29
-
30
-
31
-
32
-
33
-
34
-
35
-
36
-
37
-
38
-
39
-
40
-
41
-
42
-
43
-
44
-
45
-
46
-
47
-
 48
48 -
 49
49 -
 50
50 -
 51
51 -
 52
52 -
 53
53 -
 54
54 -
 55
55 -
 56
56 -
 57
57 -
 58
58 -
 59
59 -
 60
60 -
 61
61 -
 62
62 -
 63
63 -
 64
64 -
 65
65 -
 66
66 -
 67
67 -
 68
68 -
69
-
70
-
71
-
72
-
73
-
74
-
75
-
76
-
77
-
78
-
79
-
80
-
81
-
82
-
83
-
84
-
85
-
86
-
87
-
88
-
89
-
90
-
91
-
92
-
93
-
94
-
95
-
96
-
97
-
98
-
99
-
100
-
101
-
102
-
103
-
104
-
105
-
106
-
107
-
108
-
109
-
110
-
111
-
112
-
113
-
114
-
115
-
116
-
117
-
118
-
119
-
120
-
121
-
122
-
123
-
124
-
125
-
126
-
127
-
128
-
129
-
130
-
131
-
132
-
133
-
134
-
135
-
136
-
137
-
138
-
139
-
140
-
141
-
142
-
143
-
144
-
145
-
146
-
147
-
148
-
149
-
150
-
151
-
152
-
153
-
154
-
155
-
156
-
157
-
158
-
159
-
160
-
161
-
162
-
163
-
164
-
165
-
166
-
167
-
168
-
169
-
170
-
171
-
172
-
173
-
174
-
175
-
176
-
177
-
178
-
179
-
180
-
181
-
182
-
183
-
184
-
185
-
186
-
187
-
188
-
189
-
190
-
191
-
192
-
193
-
194
-
195
-
196
-
197
-
198
-
199
-
200
-
201
-
202
 |
 |

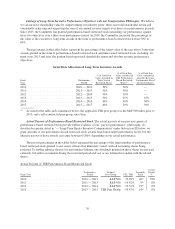
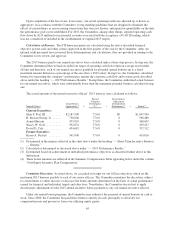
(1) Linear interpolation is used when our relative TSR performance is between the threshold, target and
maximum amounts to determine the corresponding percentage of the target award earned.
An overview of our absolute revenue performance-based restricted shares granted in 2015 is outlined
below.
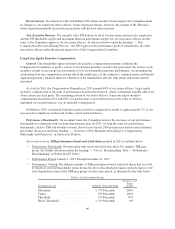
• Performance Benchmark: An absolute revenue target over the below-described three-year performance
period, which is equal to the sum of three annual absolute revenue targets separately established by the
Committee during the first quarter of the years 2015, 2016, and 2017. “Absolute revenue” is defined as
the sum of our consolidated legacy and strategic revenue, in each case defined in the same manner we
reported such amounts in our Annual Report on Form 10-K for the prior year.
•Performance Period: January 1, 2015 through December 31, 2017.
• Performance Vesting: The ultimate number of our absolute revenue performance-based restricted
shares that vest will be based on our achievement of the aggregate three-year absolute revenue target,
as illustrated in the table below; provided, however, none of our absolute revenue performance-based
restricted shares will vest unless we attain a 6% operating cash flow annual return on average assets
during the performance period. Upon completion of the fiscal year, if necessary, our actual operating
results are adjusted in accordance with the Committee’s long-standing guidelines that are designed to
eliminate the effects of extraordinary or non-recurring transactions that were not known, anticipated or
quantifiable on the date the performance goals were established. The Committee intends to use these
same guidelines to adjust, as necessary, our actual revenues over the three-year performance period
with respect to the absolute revenue performance-based restricted shares awarded in 2015.
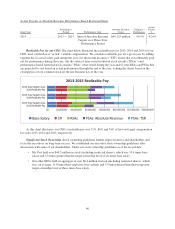
Absolute Revenue
Performance Level Company’s Performance(1)
Payout as % of
Target
Award(2)
Maximum .......................... ≥103.5% 200%
Target ............................. 100.0% 100%
Threshold .......................... 96.5% 50%
Below Threshold .................... <96.5% 0%
(1) Sum of absolute revenue actually attained for the years 2015, 2016 and 2017 divided by the sum of absolute
revenue targets separately established for each of the years 2015, 2016 and 2017.
(2) Linear interpolation is used when our absolute revenue performance is between the threshold, target and
maximum amounts to determine the corresponding percentage of target award earned.
For additional information on the above-described grants, see “Executive Compensation – Incentive
Compensation and Other Awards.”
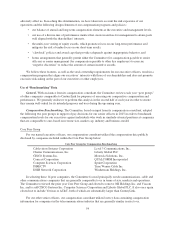
2015 Executive Grants. Following its prior deliberations in late 2014, the Committee formally approved in
February 2015 an increase to the targeted aggregate grant date fair value of Mr. Post’s equity award from
$7,500,000 to $8,500,000. This increase was the result of the Committee’s recognition of Mr. Post’s overall
leadership and performance demonstrated in 2014 and acknowledgment of his role in the execution of our
business strategy, as well as the Committee’s review of compensation benchmarking. See further discussion
under the heading “– Use of ‘Benchmarking’ Data – Performance Benchmarking” in Subsection IV below. The
Committee granted equity awards to our senior officers on terms and in amounts substantially similar to the
awards granted to them in 2014.
47