CenturyLink 2015 Annual Report Download - page 124
Download and view the complete annual report
Please find page 124 of the 2015 CenturyLink annual report below. You can navigate through the pages in the report by either clicking on the pages listed below, or by using the keyword search tool below to find specific information within the annual report.-
 1
1 -
2
-
3
-
4
-
5
-
6
-
7
-
8
-
9
-
10
-
11
-
12
-
13
-
14
-
15
-
16
-
17
-
18
-
19
-
20
-
21
-
22
-
23
-
24
-
25
-
26
-
27
-
28
-
29
-
30
-
31
-
32
-
33
-
34
-
35
-
36
-
37
-
38
-
39
-
40
-
41
-
42
-
43
-
44
-
45
-
46
-
47
-
48
-
49
-
50
-
51
-
52
-
53
-
54
-
55
-
56
-
57
-
58
-
59
-
60
-
61
-
62
-
63
-
64
-
65
-
66
-
67
-
68
-
69
-
70
-
71
-
72
-
73
-
74
-
75
-
76
-
77
-
78
-
79
-
80
-
81
-
82
-
83
-
84
-
85
-
86
-
87
-
88
-
89
-
90
-
91
-
92
-
93
-
94
-
95
-
96
-
97
-
98
-
99
-
100
-
101
-
102
-
103
-
104
-
105
-
106
-
107
-
108
-
109
-
110
-
111
-
112
-
113
-
 114
114 -
 115
115 -
 116
116 -
 117
117 -
 118
118 -
 119
119 -
 120
120 -
 121
121 -
 122
122 -
 123
123 -
 124
124 -
 125
125 -
 126
126 -
 127
127 -
 128
128 -
 129
129 -
 130
130 -
 131
131 -
 132
132 -
 133
133 -
 134
134 -
135
-
136
-
137
-
138
-
139
-
140
-
141
-
142
-
143
-
144
-
145
-
146
-
147
-
148
-
149
-
150
-
151
-
152
-
153
-
154
-
155
-
156
-
157
-
158
-
159
-
160
-
161
-
162
-
163
-
164
-
165
-
166
-
167
-
168
-
169
-
170
-
171
-
172
-
173
-
174
-
175
-
176
-
177
-
178
-
179
-
180
-
181
-
182
-
183
-
184
-
185
-
186
-
187
-
188
-
189
-
190
-
191
-
192
-
193
-
194
-
195
-
196
-
197
-
198
-
199
-
200
-
201
-
202
 |
 |
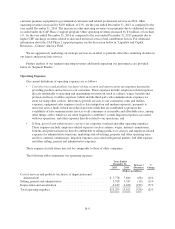
costs, software costs on selected services, installation costs and third-party facility costs. We believe
increases in operating costs have generally had a greater impact on the operating margins of our
strategic services as compared to our legacy services, principally because our strategic services rely
more heavily upon the above-listed costs;
•Legacy services. We continue to experience customers migrating away from our higher margin legacy
services into lower margin strategic services. Our legacy services revenues have been, and we expect
they will continue to be, adversely affected by access line losses and price compression. In particular,
our access, local services and long-distance revenues have been, and we expect will continue to be,
adversely affected by customer migration to more technologically advanced services, declining demand
for traditional voice services, industry consolidation and price compression caused by regulation and
rate reductions. For example, many of our business segment customers are substituting cable, wireless
and VoIP services for traditional voice telecommunications services, resulting in continued access
revenue loss. Beginning in 2016, we expect that a recent FCC order will also reduce our revenue that
we collect for local voice and long-distance services provided to correctional facilities. Although our
legacy services generally face fewer direct competitors than certain of our strategic services, customer
migration and, to a lesser degree, price compression from competitive pressures have negatively
impacted our legacy revenues and the operating margins of our legacy services. We expect this trend to
continue. Operating costs, such as installation costs and third-party facility costs, have also negatively
impacted the operating margins of our legacy services, but to a lesser extent than customer migration
and price compression. Operating costs also tend to impact our strategic services to a greater extent
than legacy services as noted above;
•Data integration. We expect both data integration revenue and the related costs will fluctuate from year
to year as this offering tends to be more sensitive than others to changes in the economy and in
spending trends of our federal, state and local governmental customers, many of whom have recently
experienced substantial budget cuts with the possibility of additional future budget cuts. Our data
integration operating margins are typically smaller than most of our other offerings; and
•Operating efficiencies. We continue to evaluate our segment operating structure and focus. This
involves balancing our workforce in response to our workload requirements, productivity
improvements and changes in industry, competitive, technological and regulatory conditions, while
achieving operational efficiencies and improving our processes through automation. However, our
ongoing efforts to increase revenue will continue to require that we incur higher costs in some areas.
We also expect our business segment to benefit indirectly from enhanced efficiencies in our company-
wide network operations.
B-16