CenturyLink 2015 Annual Report Download - page 70
Download and view the complete annual report
Please find page 70 of the 2015 CenturyLink annual report below. You can navigate through the pages in the report by either clicking on the pages listed below, or by using the keyword search tool below to find specific information within the annual report.-
 1
1 -
2
-
3
-
4
-
5
-
6
-
7
-
8
-
9
-
10
-
11
-
12
-
13
-
14
-
15
-
16
-
17
-
18
-
19
-
20
-
21
-
22
-
23
-
24
-
25
-
26
-
27
-
28
-
29
-
30
-
31
-
32
-
33
-
34
-
35
-
36
-
37
-
38
-
39
-
40
-
41
-
42
-
43
-
44
-
45
-
46
-
47
-
48
-
49
-
50
-
51
-
52
-
53
-
54
-
55
-
56
-
57
-
58
-
59
-
 60
60 -
 61
61 -
 62
62 -
 63
63 -
 64
64 -
 65
65 -
 66
66 -
 67
67 -
 68
68 -
 69
69 -
 70
70 -
 71
71 -
 72
72 -
 73
73 -
 74
74 -
 75
75 -
 76
76 -
 77
77 -
 78
78 -
 79
79 -
 80
80 -
81
-
82
-
83
-
84
-
85
-
86
-
87
-
88
-
89
-
90
-
91
-
92
-
93
-
94
-
95
-
96
-
97
-
98
-
99
-
100
-
101
-
102
-
103
-
104
-
105
-
106
-
107
-
108
-
109
-
110
-
111
-
112
-
113
-
114
-
115
-
116
-
117
-
118
-
119
-
120
-
121
-
122
-
123
-
124
-
125
-
126
-
127
-
128
-
129
-
130
-
131
-
132
-
133
-
134
-
135
-
136
-
137
-
138
-
139
-
140
-
141
-
142
-
143
-
144
-
145
-
146
-
147
-
148
-
149
-
150
-
151
-
152
-
153
-
154
-
155
-
156
-
157
-
158
-
159
-
160
-
161
-
162
-
163
-
164
-
165
-
166
-
167
-
168
-
169
-
170
-
171
-
172
-
173
-
174
-
175
-
176
-
177
-
178
-
179
-
180
-
181
-
182
-
183
-
184
-
185
-
186
-
187
-
188
-
189
-
190
-
191
-
192
-
193
-
194
-
195
-
196
-
197
-
198
-
199
-
200
-
201
-
202
 |
 |

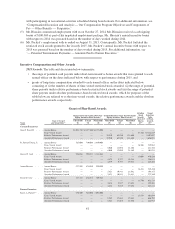
EXECUTIVE COMPENSATION
Overview
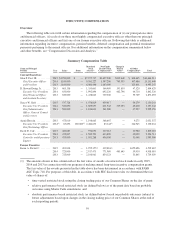
The following table sets forth certain information regarding the compensation of (i) our principal executive
and financial officers, (ii) each of our three most highly compensated executive officers other than our principal
executive and financial officers and (iii) one of our former executive officers. Following this table is additional
information regarding incentive compensation, pension benefits, deferred compensation and potential termination
payments pertaining to the named officers. For additional information on the compensation summarized below
and other benefits, see “Compensation Discussion and Analysis.”
Summary Compensation Table
Name and Principal
Position Year Salary Bonus
Restricted
Stock
Awards
(1)
Non-Equity
Incentive Plan
Compensation
(2)
Change in
Pension
Value
(3)
All Other
Compensation
(4)
Total
Current Executives:
Glen F. Post, III ..........
Chief Executive Officer
and President
2015 $1,250,000 $ — $7,277,717 $1,697,500 $330 649 $ 108,645 $10,664,511
2014 1,100,000 — 9,581,227 1,597,200 745,535 107,486 13,131,448
2013 1,100,000 — 6,086,446 1,683,000 — 123,801 8,993,247
R. Stewart Ewing, Jr. ......
Executive Vice President,
Chief Financial Officer
and Assistant Secretary
2015 663,138 — 1,335,661 566,480 191,830 47,520 2,804,629
2014 650,000 — 1,992,894 692,120 462,796 44,710 3,842,520
2013 650,000 — 1,438,623 729,300 — 55,769 2,873,692
Stacey W. Goff ...........
Executive Vice President,
Chief Administrative
Officer, General Counsel
and Secretary
2015 537,728 — 1,078,819 459,417 — 54,279 2,130,243
2014 520,890 — 1,609,657 611,942 339,053 45,600 3,127,142
2013 500,000 — 1,106,631 561,000 — 37,527 2,205,158
Aamir Hussain ...........
Executive Vice President,
Chief Technology Officer
2015 475,010 — 1,198,665 368,607 — 9,275 2,051,557
2014
(5)
85,892 100,000
(5)
2,486,653 83,144
(5)
— 344,945 3,100,634
David D. Cole ............
Executive Vice President,
Controller and Operations
Support
2015 482,687 — 976,051 337,312 — 32,960 1,829,010
2014 475,007 — 1,582,793 413,820 — 30,092 2,501,711
2013 475,000 — 1,051,288 436,050 — 31,048 1,993,386
Former Executive:
Karen A. Puckett
(6)
........ 2015 491,818 — 1,955,357
(6)
419,816
(6)
— 1,652,696 4,519,687
2014 725,000 — 2,917,475 771,980 483,645 59,910 4,958,010
2013 725,000 — 2,106,061 854,123 — 53,845 3,739,029
(1) The amounts shown in this column reflect the fair value of awards of restricted stock made in early 2015,
2014 and 2013 in connection with our program of making annual long-term incentive compensation grants.
The fair value of the awards presented in the table above has been determined in accordance with FASB
ASC Topic 718. For purposes of this table, in accordance with SEC disclosure rules we determined the fair
value of shares of:
• time-vested restricted stock using the closing trading price of our Common Shares on the day of grant;
• relative performance-based restricted stock (as defined below) as of the grant date based on probable
outcomes using Monte Carlo simulations; and
• absolute performance-based restricted stock (as defined below) based on probable outcomes (subject to
future adjustments based upon changes in the closing trading price of our Common Shares at the end of
each reporting period).
59