CenturyLink 2015 Annual Report Download - page 121
Download and view the complete annual report
Please find page 121 of the 2015 CenturyLink annual report below. You can navigate through the pages in the report by either clicking on the pages listed below, or by using the keyword search tool below to find specific information within the annual report.-
 1
1 -
2
-
3
-
4
-
5
-
6
-
7
-
8
-
9
-
10
-
11
-
12
-
13
-
14
-
15
-
16
-
17
-
18
-
19
-
20
-
21
-
22
-
23
-
24
-
25
-
26
-
27
-
28
-
29
-
30
-
31
-
32
-
33
-
34
-
35
-
36
-
37
-
38
-
39
-
40
-
41
-
42
-
43
-
44
-
45
-
46
-
47
-
48
-
49
-
50
-
51
-
52
-
53
-
54
-
55
-
56
-
57
-
58
-
59
-
60
-
61
-
62
-
63
-
64
-
65
-
66
-
67
-
68
-
69
-
70
-
71
-
72
-
73
-
74
-
75
-
76
-
77
-
78
-
79
-
80
-
81
-
82
-
83
-
84
-
85
-
86
-
87
-
88
-
89
-
90
-
91
-
92
-
93
-
94
-
95
-
96
-
97
-
98
-
99
-
100
-
101
-
102
-
103
-
104
-
105
-
106
-
107
-
108
-
109
-
110
-
 111
111 -
 112
112 -
 113
113 -
 114
114 -
 115
115 -
 116
116 -
 117
117 -
 118
118 -
 119
119 -
 120
120 -
 121
121 -
 122
122 -
 123
123 -
 124
124 -
 125
125 -
 126
126 -
 127
127 -
 128
128 -
 129
129 -
 130
130 -
 131
131 -
132
-
133
-
134
-
135
-
136
-
137
-
138
-
139
-
140
-
141
-
142
-
143
-
144
-
145
-
146
-
147
-
148
-
149
-
150
-
151
-
152
-
153
-
154
-
155
-
156
-
157
-
158
-
159
-
160
-
161
-
162
-
163
-
164
-
165
-
166
-
167
-
168
-
169
-
170
-
171
-
172
-
173
-
174
-
175
-
176
-
177
-
178
-
179
-
180
-
181
-
182
-
183
-
184
-
185
-
186
-
187
-
188
-
189
-
190
-
191
-
192
-
193
-
194
-
195
-
196
-
197
-
198
-
199
-
200
-
201
-
202
 |
 |

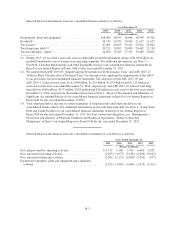
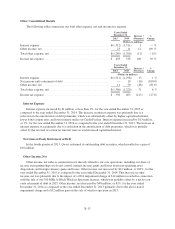
Other Consolidated Results
The following tables summarize our total other expense, net and income tax expense:
Years Ended
December 31, Increase /
(Decrease)
%
Change2015 2014
(Dollars in millions)
Interest expense .............................................. $(1,312) (1,311) 1 — %
Other income, net ............................................. 23 11 12 109%
Total other expense, net ........................................ $(1,289) (1,300) (11) (1)%
Income tax expense ........................................... $ 438 338 100 30%
Years Ended
December 31, Increase /
(Decrease)
%
Change2014 2013
(Dollars in millions)
Interest expense .............................................. $(1,311) (1,298) 13 1 %
Net gain on early retirement of debt .............................. — 10 (10) (100)%
Other income, net ............................................. 11 59 (48) (81)%
Total other expense, net ........................................ $(1,300) (1,229) 71 6 %
Income tax expense ........................................... $ 338 463 (125) (27)%
Interest Expense
Interest expense increased by $1 million, or less than 1%, for the year ended December 31, 2015 as
compared to the year ended December 31, 2014. The increase in interest expense was primarily due to a
reduction in the amortization of debt premiums, which was substantially offset by higher capitalized interest,
lower bond coupon rates and lower interest under our Credit Facility. Interest expense increased by $13 million,
or 1%, for the year ended December 31, 2014 as compared to the year ended December 31, 2013. The increase in
interest expense was primarily due to a reduction in the amortization of debt premiums, which was partially
offset by the reversal of certain tax interest reserves and increased capitalized interest.
Net Gain on Early Retirement of Debt
In the fourth quarter of 2013, Qwest redeemed its outstanding debt securities, which resulted in a gain of
$10 million.
Other Income, Net
Other income, net reflects certain items not directly related to our core operations, including our share of
income from partnerships we do not control, interest income, gains and losses from non-operating asset
dispositions and foreign currency gains and losses. Other income, net increased by $12 million, or 109%, for the
year ended December 31, 2015 as compared to the year ended December 31, 2014. This increase in other
income, net was primarily due to the impact of a 2014 impairment charge of $14 million recorded in connection
with the sale of our 700 MHz A-Block Wireless Spectrum licenses, which was partially offset by a net loss on
early retirement of debt in 2015. Other income, net decreased by $48 million, or 81%, for the year ended
December 31, 2014 as compared to the year ended December 31, 2013 primarily due to the above-noted
impairment charge and a $32 million gain on the sale of wireless spectrum in 2013.
B-13