CenturyLink 2015 Annual Report Download - page 182
Download and view the complete annual report
Please find page 182 of the 2015 CenturyLink annual report below. You can navigate through the pages in the report by either clicking on the pages listed below, or by using the keyword search tool below to find specific information within the annual report.-
 1
1 -
2
-
3
-
4
-
5
-
6
-
7
-
8
-
9
-
10
-
11
-
12
-
13
-
14
-
15
-
16
-
17
-
18
-
19
-
20
-
21
-
22
-
23
-
24
-
25
-
26
-
27
-
28
-
29
-
30
-
31
-
32
-
33
-
34
-
35
-
36
-
37
-
38
-
39
-
40
-
41
-
42
-
43
-
44
-
45
-
46
-
47
-
48
-
49
-
50
-
51
-
52
-
53
-
54
-
55
-
56
-
57
-
58
-
59
-
60
-
61
-
62
-
63
-
64
-
65
-
66
-
67
-
68
-
69
-
70
-
71
-
72
-
73
-
74
-
75
-
76
-
77
-
78
-
79
-
80
-
81
-
82
-
83
-
84
-
85
-
86
-
87
-
88
-
89
-
90
-
91
-
92
-
93
-
94
-
95
-
96
-
97
-
98
-
99
-
100
-
101
-
102
-
103
-
104
-
105
-
106
-
107
-
108
-
109
-
110
-
111
-
112
-
113
-
114
-
115
-
116
-
117
-
118
-
119
-
120
-
121
-
122
-
123
-
124
-
125
-
126
-
127
-
128
-
129
-
130
-
131
-
132
-
133
-
134
-
135
-
136
-
137
-
138
-
139
-
140
-
141
-
142
-
143
-
144
-
145
-
146
-
147
-
148
-
149
-
150
-
151
-
152
-
153
-
154
-
155
-
156
-
157
-
158
-
159
-
160
-
161
-
162
-
163
-
164
-
165
-
166
-
167
-
168
-
169
-
170
-
171
-
 172
172 -
 173
173 -
 174
174 -
 175
175 -
 176
176 -
 177
177 -
 178
178 -
 179
179 -
 180
180 -
 181
181 -
 182
182 -
 183
183 -
 184
184 -
 185
185 -
 186
186 -
 187
187 -
 188
188 -
 189
189 -
 190
190 -
 191
191 -
 192
192 -
193
-
194
-
195
-
196
-
197
-
198
-
199
-
200
-
201
-
202
 |
 |

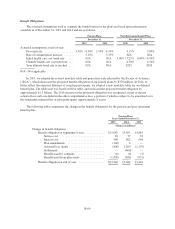
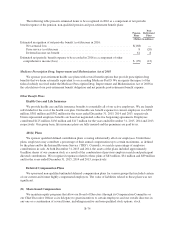
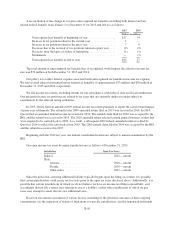
The following table presents estimated items to be recognized in 2016 as a component of net periodic
benefit expense of the pension, non-qualified pension and post-retirement benefit plans:
Pension
Plans
Post-
Retirement
Plans
(Dollars in millions)
Estimated recognition of net periodic benefit (cost)/income in 2016:
Net actuarial loss ........................................................ $(168) —
Prior service (cost)/income ................................................ 8 (20)
Deferred income tax benefit ............................................... 61 8
Estimated net periodic benefit expense to be recorded in 2016 as a component of other
comprehensive income (loss) ................................................ $ (99) (12)
Medicare Prescription Drug, Improvement and Modernization Act of 2003
We sponsor post-retirement health care plans with several benefit options that provide prescription drug
benefits that we deem actuarially equivalent to or exceeding Medicare Part D. We recognize the impact of the
federal subsidy received under the Medicare Prescription Drug, Improvement and Modernization Act of 2003 in
the calculation of our post-retirement benefit obligation and net periodic post-retirement benefit expense.
Other Benefit Plans
Health Care and Life Insurance
We provide health care and life insurance benefits to essentially all of our active employees. We are largely
self-funded for the cost of the health care plan. Our health care benefit expense for current employees was $381
million, $381 million and $362 million for the years ended December 31, 2015, 2014 and 2013, respectively.
Union-represented employee benefits are based on negotiated collective bargaining agreements. Employees
contributed $125 million, $136 million and $117 million for the years ended December 31, 2015, 2014 and 2013,
respectively. Our group basic life insurance plans are fully insured and the premiums are paid by us.
401(k) Plans
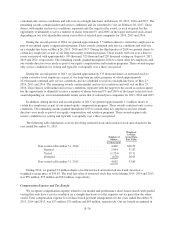
We sponsor qualified defined contribution plans covering substantially all of our employees. Under these
plans, employees may contribute a percentage of their annual compensation up to certain maximums, as defined
by the plans and by the Internal Revenue Service (“IRS”). Currently, we match a percentage of employee
contributions in cash. At both December 31, 2015 and 2014, the assets of the plans included approximately
8 million shares of our common stock as a result of the combination of previous employer match and participant
directed contributions. We recognized expenses related to these plans of $83 million, $81 million and $89 million
and for the years ended December 31, 2015, 2014 and 2013, respectively.
Deferred Compensation Plans
We sponsored non-qualified unfunded deferred compensation plans for various groups that included certain
of our current and former highly compensated employees. The value of liabilities related to these plans was not
significant.
(8) Share-based Compensation
We maintain equity programs that allow our Board of Directors (through its Compensation Committee or
our Chief Executive Officer as its delegate) to grant incentives to certain employees and our outside directors in
any one or a combination of several forms, including incentive and non-qualified stock options, stock
B-74