CenturyLink 2015 Annual Report Download - page 54
Download and view the complete annual report
Please find page 54 of the 2015 CenturyLink annual report below. You can navigate through the pages in the report by either clicking on the pages listed below, or by using the keyword search tool below to find specific information within the annual report.
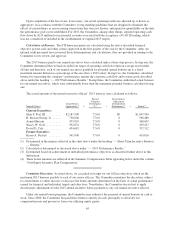
The table below summarizes the 2015 STI bonus opportunities for our named executive officers. Except as
noted in the table, the Committee in 2015 made no changes to our named executive officers’ prior bonus targets.
Named Officer
2015
Salary(1) x
Bonus
Target % =
Target Bonus
Opportunity
Current Executives:
Glen F. Post, III ..................... $1,250,000 175%(2) $2,187,500
R. Stewart Ewing, Jr. ................. 663,138 110% 730,000
Aamir Hussain ...................... 85,892 100% 475,010
Stacey W. Goff ..................... 537,728 110% 592,032
David D. Cole ...................... 482,687 90% 434,681
Former Executive:
Karen A. Puckett(3) .................. 491,818 110% 541,000
(1) Salary reflected in this table represents earned salary during 2015 and includes (i) Mr. Post’s above-
described salary increase, effective January 1, 2015, and (ii) salary increases, effective on March 1, 2015,
which increased the salary of Mr. Ewing from $650,000 to $666,250, the salary of Mr. Goff from $525,000
to $540,750, and the salary of Mr. Cole from $475,000 to $484,500. Salary for Mrs. Puckett represents
salary earned during 2015 through her last day of work on August 31, 2015 and includes a salary increase
from $725,000 to $743,125 that became effective on March 1, 2015.
(2) As noted above, the Committee increased Mr. Post’s bonus target percentage from 150% to 175%, effective
January 1, 2015.
(3) As discussed further below, Ms. Puckett was eligible to earn a bonus based on (i) her salary through
August 31, 2015 and (ii) actual performance.
Performance Objectives and Targets. Each year, the Committee reviews in detail the relevance of our STI
performance objectives for alignment with our business goals and objectives. In February 2015, the Committee
reaffirmed its decision in early 2014 to offer STI bonuses for all senior officers based upon our attainment of
consolidated operating cash flow and consolidated core revenue targets. See the further discussion under the
heading “— Overview of Pay Elements and Linkage to Compensation Philosophy and Objectives” in Subsection
II above.
In February 2015, the Committee, after discussion with our CEO, approved (i) the target level, of 6%, of
operating cash flow return on average assets for purposes of fixing the maximum amount of potential annual
bonuses for 2015 payable to our senior officers in accordance with Section 162(m) of the Internal Revenue Code,
and (ii) the following threshold, target, and maximum performance levels for 2015 operating cash flow and core
revenue.
Performance Levels (in millions)
Financial Performance Objectives Weighting Threshold Target(1) Maximum
Consolidated Operating Cash Flow(2) ....... 50% $ 6,555.00 $ 6,900.00 $ 7,245.00
Consolidated Core Revenue(3) ............. 50% 15,777.75 16,350.00 16,922.25
(1) Based upon the same forecasts used in connection with our publicly-disclosed guidance.
(2) Represents operating income plus depreciation and amortization expenses.
(3) Represents the sum of strategic revenues and legacy revenues (excluding our data integration and other
revenues), all as reported in our publicly-filed financial statements.
In February 2015, the Committee, in collaboration with our CEO, also approved guidelines designed to
enable the Committee, in its discretion, to increase or decrease the bonus of each senior officer by up to 10%,
based on the officer’s individual performance during 2015 with respect to (i) assisting the Company to meet its
expense budget, (ii) exhibiting collaboration and leadership skills, (iii) attaining three to four specific pre-
43


