CenturyLink 2015 Annual Report Download - page 49
Download and view the complete annual report
Please find page 49 of the 2015 CenturyLink annual report below. You can navigate through the pages in the report by either clicking on the pages listed below, or by using the keyword search tool below to find specific information within the annual report.-
 1
1 -
2
-
3
-
4
-
5
-
6
-
7
-
8
-
9
-
10
-
11
-
12
-
13
-
14
-
15
-
16
-
17
-
18
-
19
-
20
-
21
-
22
-
23
-
24
-
25
-
26
-
27
-
28
-
29
-
30
-
31
-
32
-
33
-
34
-
35
-
36
-
37
-
38
-
 39
39 -
 40
40 -
 41
41 -
 42
42 -
 43
43 -
 44
44 -
 45
45 -
 46
46 -
 47
47 -
 48
48 -
 49
49 -
 50
50 -
 51
51 -
 52
52 -
 53
53 -
 54
54 -
 55
55 -
 56
56 -
 57
57 -
 58
58 -
 59
59 -
60
-
61
-
62
-
63
-
64
-
65
-
66
-
67
-
68
-
69
-
70
-
71
-
72
-
73
-
74
-
75
-
76
-
77
-
78
-
79
-
80
-
81
-
82
-
83
-
84
-
85
-
86
-
87
-
88
-
89
-
90
-
91
-
92
-
93
-
94
-
95
-
96
-
97
-
98
-
99
-
100
-
101
-
102
-
103
-
104
-
105
-
106
-
107
-
108
-
109
-
110
-
111
-
112
-
113
-
114
-
115
-
116
-
117
-
118
-
119
-
120
-
121
-
122
-
123
-
124
-
125
-
126
-
127
-
128
-
129
-
130
-
131
-
132
-
133
-
134
-
135
-
136
-
137
-
138
-
139
-
140
-
141
-
142
-
143
-
144
-
145
-
146
-
147
-
148
-
149
-
150
-
151
-
152
-
153
-
154
-
155
-
156
-
157
-
158
-
159
-
160
-
161
-
162
-
163
-
164
-
165
-
166
-
167
-
168
-
169
-
170
-
171
-
172
-
173
-
174
-
175
-
176
-
177
-
178
-
179
-
180
-
181
-
182
-
183
-
184
-
185
-
186
-
187
-
188
-
189
-
190
-
191
-
192
-
193
-
194
-
195
-
196
-
197
-
198
-
199
-
200
-
201
-
202
 |
 |

• The individual performance objectives provide “line of sight” to each senior officer’s performance
regarding their specific areas of responsibility. In addition, we utilize this aspect of the short-term
incentive plan design to reinforce leadership behaviors promoting our Unifying Principles and
expectations of our broader workforce. We believe that successfully executing on clearly defined
individual performance objectives will help us improve team collaboration, expand our product lines,
refine our market strategies, strengthen our network, execute expansion opportunities, reduce costs and
otherwise improve our operations.
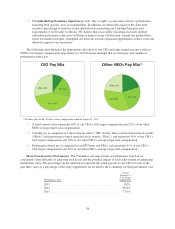
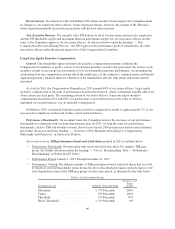
The following chart illustrates the approximate allocation of our CEO and other named executive officers
(NEOs) total target compensation opportunity for 2015 between elements that are fixed pay and variable or
performance-based pay:
Salary,
10%
STI, 18%
PSA, 43%
RSAs, 28%
CEO Pay Mix
Salary,
22%
STI, 23%
PSA, 33%
RSAs, 22%
Other NEOs Pay Mix(1)
(1) Excludes data for Ms. Puckett, whose employment ended on August 31, 2015.
• A fixed annual salary represents 10% of our CEO’s total target compensation and 22% of our other
NEOs average target total compensation.
• Variable pay is comprised of a short-term incentive (“STI”) bonus, time-vested restricted stock awards
(“RSAs”) and performance-based restricted stock awards (“PSAs”), and represents 90% of our CEO’s
total target compensation and 78% of our other NEO’s average target total compensation.
• Performance-based pay is comprised of an STI bonus and PSAs, and represents 61% of our CEO’s
total target compensation and 56% of our other NEO’s average target total compensation.
Short-Term Incentive Performance. The Committee sets target levels of performance based on its
assessment of the difficulty of achieving such levels and the potential impact of such achievement on enhancing
shareholder value. The percentages in the table below represent the actual payouts to our CEO for each of the
past three years as a percentage of the target opportunity set for him by the Committee for that performance year.
Performance Year
Actual
Payout as a
% of Target
Opportunity
2013 .............................................. 102%
2014 .............................................. 96.8%
2015 .............................................. 77.6%
38