CenturyLink 2015 Annual Report Download - page 46
Download and view the complete annual report
Please find page 46 of the 2015 CenturyLink annual report below. You can navigate through the pages in the report by either clicking on the pages listed below, or by using the keyword search tool below to find specific information within the annual report.-
 1
1 -
2
-
3
-
4
-
5
-
6
-
7
-
8
-
9
-
10
-
11
-
12
-
13
-
14
-
15
-
16
-
17
-
18
-
19
-
20
-
21
-
22
-
23
-
24
-
25
-
26
-
27
-
28
-
29
-
30
-
31
-
32
-
33
-
34
-
35
-
 36
36 -
 37
37 -
 38
38 -
 39
39 -
 40
40 -
 41
41 -
 42
42 -
 43
43 -
 44
44 -
 45
45 -
 46
46 -
 47
47 -
 48
48 -
 49
49 -
 50
50 -
 51
51 -
 52
52 -
 53
53 -
 54
54 -
 55
55 -
 56
56 -
57
-
58
-
59
-
60
-
61
-
62
-
63
-
64
-
65
-
66
-
67
-
68
-
69
-
70
-
71
-
72
-
73
-
74
-
75
-
76
-
77
-
78
-
79
-
80
-
81
-
82
-
83
-
84
-
85
-
86
-
87
-
88
-
89
-
90
-
91
-
92
-
93
-
94
-
95
-
96
-
97
-
98
-
99
-
100
-
101
-
102
-
103
-
104
-
105
-
106
-
107
-
108
-
109
-
110
-
111
-
112
-
113
-
114
-
115
-
116
-
117
-
118
-
119
-
120
-
121
-
122
-
123
-
124
-
125
-
126
-
127
-
128
-
129
-
130
-
131
-
132
-
133
-
134
-
135
-
136
-
137
-
138
-
139
-
140
-
141
-
142
-
143
-
144
-
145
-
146
-
147
-
148
-
149
-
150
-
151
-
152
-
153
-
154
-
155
-
156
-
157
-
158
-
159
-
160
-
161
-
162
-
163
-
164
-
165
-
166
-
167
-
168
-
169
-
170
-
171
-
172
-
173
-
174
-
175
-
176
-
177
-
178
-
179
-
180
-
181
-
182
-
183
-
184
-
185
-
186
-
187
-
188
-
189
-
190
-
191
-
192
-
193
-
194
-
195
-
196
-
197
-
198
-
199
-
200
-
201
-
202
 |
 |
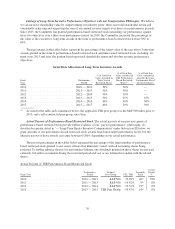
2015 Business Highlights. During 2015, we achieved several significant accomplishments, including the
following:
• Generated 2015 free cash flow of $2.7 billion and returned $2.0 billion to shareholders through a
combination of dividends and share repurchases.
• Invested in our network to improve available transmission speeds across our markets, resulting in the
growth of the percentage of broadband-enabled access lines receiving at least 20 megabits per second
(Mbps) to nearly 60% and those receiving at least 40 Mbps to more than 30%.
• Invested in fiber-to-the home technology that allows us to deliver speeds of up to 1 gigabit per second
to over 600,000 households in 2015, finishing the year with nearly 950,000 households enabled with
this technology and approximately 490,000 business locations capable of receiving this technology.
• Obtained funding from the Federal Communications Commission’s Connect America Fund Phase 2
program that will enable us to offer high-speed Internet services to approximately 1.2 million rural
households and businesses in 33 states.
• Added approximately 44,000 Prism TV customers during the year, and expanded availability of this IP
television product to over 800,000 new homes in both new and existing markets, bringing total homes
enabled to nearly 3.2 million.
• Launched more than 50 new products and services or enhancements to existing products and services
— including launching CenturyLink Business Communicator; enhancing our software-defined
networking (SDN) and network functions virtualization (NFV) capabilities; expanding our managed
security and Internet of Things (IoT) service offerings; expanding our VoIP collaboration offerings;
globally expanding our cloud node locations and data center footprint to strengthen our managed
services, cloud and colocation offerings; and enhancing our Hybrid IT portfolio.
• Endeavored to offset the decline in our legacy services revenue with growth in our strategic services
revenues.
• Initiated a strategic alternatives review for our data center and colocation businesses.
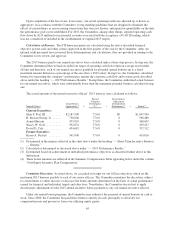
2015 Executive Compensation Highlights. During 2015, the Compensation Committee of our Board (the
“Committee”) took various steps to (i) maintain the strong linkage between executive pay and our performance
and strategic goals and (ii) refine the compensation packages of our senior officers to ensure that they remained
targeted at the 50th percentile of market compensation levels. Our recent key executive compensation decisions
and highlights are summarized below.
• In May 2015, our shareholders cast approximately 95% of their votes in favor of our annual “say on
pay” proposal.
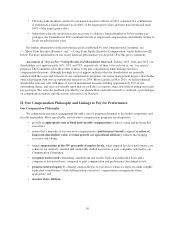
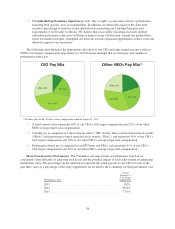
• Our executive compensation program for 2015 continued to emphasize variable “at risk”
compensation, with a majority of our named executive officers’ compensation delivered through a
combination of short- and long-term performance-driven incentives (which, for our CEO, represented
over 90% of his total target compensation).
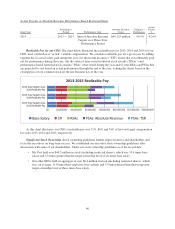
• As in prior years, the Committee set challenging performance targets under our incentive programs to
ensure that payouts track corporate performance. Specifically:
• Our short-term incentive bonus payouts for 2015 operating performance were 77.6% of targeted
amounts for our named executive officers.
• Over half of the performance-based restricted shares originally granted to our named executives in
2013 were forfeited following the end of 2015 as our actual performance over the three-year
period (January 1, 2013-December 31, 2015) fell below our payout threshold for the total
shareholder return (“TSR”) metric and below target for the absolute metric.
35