CenturyLink 2015 Annual Report Download - page 117
Download and view the complete annual report
Please find page 117 of the 2015 CenturyLink annual report below. You can navigate through the pages in the report by either clicking on the pages listed below, or by using the keyword search tool below to find specific information within the annual report.-
 1
1 -
2
-
3
-
4
-
5
-
6
-
7
-
8
-
9
-
10
-
11
-
12
-
13
-
14
-
15
-
16
-
17
-
18
-
19
-
20
-
21
-
22
-
23
-
24
-
25
-
26
-
27
-
28
-
29
-
30
-
31
-
32
-
33
-
34
-
35
-
36
-
37
-
38
-
39
-
40
-
41
-
42
-
43
-
44
-
45
-
46
-
47
-
48
-
49
-
50
-
51
-
52
-
53
-
54
-
55
-
56
-
57
-
58
-
59
-
60
-
61
-
62
-
63
-
64
-
65
-
66
-
67
-
68
-
69
-
70
-
71
-
72
-
73
-
74
-
75
-
76
-
77
-
78
-
79
-
80
-
81
-
82
-
83
-
84
-
85
-
86
-
87
-
88
-
89
-
90
-
91
-
92
-
93
-
94
-
95
-
96
-
97
-
98
-
99
-
100
-
101
-
102
-
103
-
104
-
105
-
106
-
 107
107 -
 108
108 -
 109
109 -
 110
110 -
 111
111 -
 112
112 -
 113
113 -
 114
114 -
 115
115 -
 116
116 -
 117
117 -
 118
118 -
 119
119 -
 120
120 -
 121
121 -
 122
122 -
 123
123 -
 124
124 -
 125
125 -
 126
126 -
 127
127 -
128
-
129
-
130
-
131
-
132
-
133
-
134
-
135
-
136
-
137
-
138
-
139
-
140
-
141
-
142
-
143
-
144
-
145
-
146
-
147
-
148
-
149
-
150
-
151
-
152
-
153
-
154
-
155
-
156
-
157
-
158
-
159
-
160
-
161
-
162
-
163
-
164
-
165
-
166
-
167
-
168
-
169
-
170
-
171
-
172
-
173
-
174
-
175
-
176
-
177
-
178
-
179
-
180
-
181
-
182
-
183
-
184
-
185
-
186
-
187
-
188
-
189
-
190
-
191
-
192
-
193
-
194
-
195
-
196
-
197
-
198
-
199
-
200
-
201
-
202
 |
 |

customer premises equipment to governmental customers and related professional services in 2014. Other
operating revenues increased by $229 million, or 23%, for the year ended December 31, 2015 as compared to the
year ended December 31, 2014. The increase in other operating revenues was primarily due to additional revenue
recorded under the CAF Phase 2 support program. Other operating revenues increased by $3 million, or less than
1%, for the year ended December 31, 2014 as compared to the year ended December 31, 2013 primarily due to
higher USF surcharge revenues related to increased universal service fund contribution factors. For additional
information about the CAF Phase 2 support program, see the discussion below in “Liquidity and Capital
Resources—Connect America Fund.”
We are aggressively marketing our strategic services in an effort to partially offset the continuing declines in
our legacy and private line services.
Further analysis of our segment operating revenues and trends impacting our performance are provided
below in “Segment Results.”
Operating Expenses
Our current definitions of operating expenses are as follows:
•Cost of services and products (exclusive of depreciation and amortization) are expenses incurred in
providing products and services to our customers. These expenses include: employee-related expenses
directly attributable to operating and maintaining our network (such as salaries, wages, benefits and
professional fees); facilities expenses (which include third-party telecommunications expenses we
incur for using other carriers’ networks to provide services to our customers); rents and utilities
expenses; equipment sales expenses (such as data integration and modem expenses); payments to
universal service funds (which are federal and state funds that are established to promote the
availability of telecommunications services to all consumers at reasonable and affordable rates, among
other things, and to which we are often required to contribute); certain litigation expenses associated
with our operations; and other expenses directly related to our operations; and
•Selling, general and administrative expenses are corporate overhead and other operating expenses.
These expenses include: employee-related expenses (such as salaries, wages, internal commissions,
benefits and professional fees) directly attributable to selling products or services and employee-related
expenses for administrative functions; marketing and advertising; property and other operating taxes
and fees; external commissions; litigation expenses associated with general matters; bad debt expense;
and other selling, general and administrative expenses.
These expense classifications may not be comparable to those of other companies.
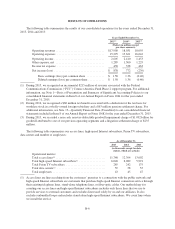
The following tables summarize our operating expenses:
Years Ended
December 31, Increase /
(Decrease)
%
Change2015 2014
(Dollars in millions)
Cost of services and products (exclusive of depreciation and
amortization) ............................................. $ 7,778 7,846 (68) (1)%
Selling, general and administrative .............................. 3,328 3,347 (19) (1)%
Depreciation and amortization .................................. 4,189 4,428 (239) (5)%
Total operating expenses ...................................... $15,295 15,621 (326) (2)%
B-9