CenturyLink 2015 Annual Report Download - page 56
Download and view the complete annual report
Please find page 56 of the 2015 CenturyLink annual report below. You can navigate through the pages in the report by either clicking on the pages listed below, or by using the keyword search tool below to find specific information within the annual report.-
 1
1 -
2
-
3
-
4
-
5
-
6
-
7
-
8
-
9
-
10
-
11
-
12
-
13
-
14
-
15
-
16
-
17
-
18
-
19
-
20
-
21
-
22
-
23
-
24
-
25
-
26
-
27
-
28
-
29
-
30
-
31
-
32
-
33
-
34
-
35
-
36
-
37
-
38
-
39
-
40
-
41
-
42
-
43
-
44
-
45
-
 46
46 -
 47
47 -
 48
48 -
 49
49 -
 50
50 -
 51
51 -
 52
52 -
 53
53 -
 54
54 -
 55
55 -
 56
56 -
 57
57 -
 58
58 -
 59
59 -
 60
60 -
 61
61 -
 62
62 -
 63
63 -
 64
64 -
 65
65 -
 66
66 -
67
-
68
-
69
-
70
-
71
-
72
-
73
-
74
-
75
-
76
-
77
-
78
-
79
-
80
-
81
-
82
-
83
-
84
-
85
-
86
-
87
-
88
-
89
-
90
-
91
-
92
-
93
-
94
-
95
-
96
-
97
-
98
-
99
-
100
-
101
-
102
-
103
-
104
-
105
-
106
-
107
-
108
-
109
-
110
-
111
-
112
-
113
-
114
-
115
-
116
-
117
-
118
-
119
-
120
-
121
-
122
-
123
-
124
-
125
-
126
-
127
-
128
-
129
-
130
-
131
-
132
-
133
-
134
-
135
-
136
-
137
-
138
-
139
-
140
-
141
-
142
-
143
-
144
-
145
-
146
-
147
-
148
-
149
-
150
-
151
-
152
-
153
-
154
-
155
-
156
-
157
-
158
-
159
-
160
-
161
-
162
-
163
-
164
-
165
-
166
-
167
-
168
-
169
-
170
-
171
-
172
-
173
-
174
-
175
-
176
-
177
-
178
-
179
-
180
-
181
-
182
-
183
-
184
-
185
-
186
-
187
-
188
-
189
-
190
-
191
-
192
-
193
-
194
-
195
-
196
-
197
-
198
-
199
-
200
-
201
-
202
 |
 |

Upon completion of the fiscal year, if necessary, our actual operating results are adjusted up or down, as
appropriate, in accordance with the Committee’s long-standing guidelines that are designed to eliminate the
effects of extraordinary or non-recurring transactions that were not known, anticipated or quantifiable on the date
the performance goals were established. For 2015, the Committee, among other things, adjusted operating cash
flow down by $215 million for incremental revenue associated with the acceptance of CAF II funding, which
was not considered or included in the establishment of original 2015 targets.
Calculation of Bonuses. The STI bonus payments are calculated using the above-described financial
objective payout scale and other criteria approved in the first quarter of the year by the Committee. After our
internal audit personnel have reviewed these determinations and calculations, they are provided in writing to the
Committee for its review and approval.
The 2015 bonuses paid to our named executives were calculated under a three-step process. In step one, the
Committee determined that we had exceeded our target of operating cash flow return on average assets under
162(m) and therefore, each of our named executives qualified for potential annual bonuses up to a fixed
maximum amount defined as a percentage of the executive’s 2015 salary. In step two, the Committee calculated
bonuses by measuring the company’s performance against the corporate cash flow and revenue goals described
above under the heading “— 2015 Performance Results.” In step three, the Committee authorized actual bonuses
for our named executives, which were substantially lower than the maximum potential bonuses calculated in step
one.
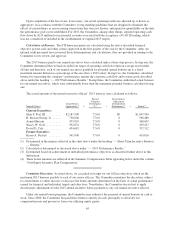
The actual amounts of the named executive officers’ 2015 bonuses were calculated as follows:
Named Officer
Target Bonus
Opportunity(1) x
Earned
Company
Performance
%(2) +
Discretionary
Adjustment
for Individual
Performance(3) = Bonus(4)
Current Executives:
Glen F. Post, III .......... $2,187,500 77.6% $0 $1,697,500
R. Stewart Ewing, Jr. ...... 730,000 77.6% 0 566,480
Aamir Hussain ........... 475,010 77.6% 0 368,607
Stacey W. Goff ........... 592,032 77.6% 0 459,417
David D. Cole ............ 434,681 77.6% 0 337,312
Former Executive:
Karen A. Puckett ......... 541,000 77.6% 0 419,816
(1) Determined in the manner reflected in the chart above under the heading “— Short-Term Incentive Bonuses
— General.”
(2) Calculated or determined as discussed above under “— 2015 Performance Results.”
(3) Determined based on achievement of individual performance objectives as described further above in this
Subsection.
(4) These bonus amounts are reflected in the Summary Compensation Table appearing below under the column
“Non-Equity Incentive Plan Compensation.”
Committee Discretion. As noted above, we exceeded our target for our 162(m) objectives which set the
maximum 2015 bonuses payable to each of our senior officers. The Committee maintains the discretion, subject
to certain limits, to either increase or decrease the bonus amounts determined on the basis of actual performance
earned for financial and individual targets and objectives. Nonetheless, the Committee elected not to apply
discretionary adjustments for the 2015 annual incentive bonus payments to any our named executive officers.
Under our annual bonus programs, the Committee may authorize the payment of annual bonuses in cash or
stock. Since 2000, the Committee has paid these bonuses entirely in cash, principally to diversify our
compensation mix and prevent us from over-utilizing equity grants.
45