CenturyLink 2015 Annual Report Download - page 114
Download and view the complete annual report
Please find page 114 of the 2015 CenturyLink annual report below. You can navigate through the pages in the report by either clicking on the pages listed below, or by using the keyword search tool below to find specific information within the annual report.-
 1
1 -
2
-
3
-
4
-
5
-
6
-
7
-
8
-
9
-
10
-
11
-
12
-
13
-
14
-
15
-
16
-
17
-
18
-
19
-
20
-
21
-
22
-
23
-
24
-
25
-
26
-
27
-
28
-
29
-
30
-
31
-
32
-
33
-
34
-
35
-
36
-
37
-
38
-
39
-
40
-
41
-
42
-
43
-
44
-
45
-
46
-
47
-
48
-
49
-
50
-
51
-
52
-
53
-
54
-
55
-
56
-
57
-
58
-
59
-
60
-
61
-
62
-
63
-
64
-
65
-
66
-
67
-
68
-
69
-
70
-
71
-
72
-
73
-
74
-
75
-
76
-
77
-
78
-
79
-
80
-
81
-
82
-
83
-
84
-
85
-
86
-
87
-
88
-
89
-
90
-
91
-
92
-
93
-
94
-
95
-
96
-
97
-
98
-
99
-
100
-
101
-
102
-
103
-
 104
104 -
 105
105 -
 106
106 -
 107
107 -
 108
108 -
 109
109 -
 110
110 -
 111
111 -
 112
112 -
 113
113 -
 114
114 -
 115
115 -
 116
116 -
 117
117 -
 118
118 -
 119
119 -
 120
120 -
 121
121 -
 122
122 -
 123
123 -
 124
124 -
125
-
126
-
127
-
128
-
129
-
130
-
131
-
132
-
133
-
134
-
135
-
136
-
137
-
138
-
139
-
140
-
141
-
142
-
143
-
144
-
145
-
146
-
147
-
148
-
149
-
150
-
151
-
152
-
153
-
154
-
155
-
156
-
157
-
158
-
159
-
160
-
161
-
162
-
163
-
164
-
165
-
166
-
167
-
168
-
169
-
170
-
171
-
172
-
173
-
174
-
175
-
176
-
177
-
178
-
179
-
180
-
181
-
182
-
183
-
184
-
185
-
186
-
187
-
188
-
189
-
190
-
191
-
192
-
193
-
194
-
195
-
196
-
197
-
198
-
199
-
200
-
201
-
202
 |
 |

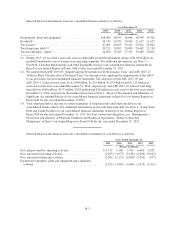
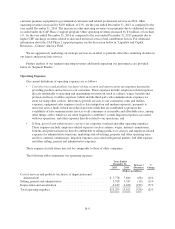
RESULTS OF OPERATIONS
The following table summarizes the results of our consolidated operations for the years ended December 31,
2015, 2014 and 2013:
Years Ended December 31,
2015(1) 2014(2) 2013(3)
(Dollars in millions except
per share amounts)
Operating revenues ................................. $17,900 18,031 18,095
Operating expenses ................................ 15,295 15,621 16,642
Operating income .................................. 2,605 2,410 1,453
Other expense, net ................................. 1,289 1,300 1,229
Income tax expense ................................ 438 338 463
Net income (loss) .................................. $ 878 772 (239)
Basic earnings (loss) per common share ............ $ 1.58 1.36 (0.40)
Diluted earnings (loss) per common share ........... $ 1.58 1.36 (0.40)
(1) During 2015, we recognized an incremental $215 million of revenue associated with the Federal
Communications Commission (“FCC”) Connect America Fund Phase 2 support program. For additional
information, see Note 1—Basis of Presentation and Summary of Significant Accounting Policies to our
consolidated financial statements in Item 8 of our Annual Report on Form 10-K for the year ended
December 31, 2015.
(2) During 2014, we recognized a $60 million tax benefit associated with a deduction for the tax basis for
worthless stock in a wholly-owned foreign subsidiary and a $63 million pension settlement charge. For
additional information, see Note 13—Quarterly Financial Data (Unaudited) to our consolidated financial
statements included in Item 8 of our Annual Report on Form 10-K for the year ended December 31, 2015.
(3) During 2013, we recorded a non-cash, non-tax-deductible goodwill impairment charge of $1.092 billion for
goodwill attributed to one of our previous operating segments and a litigation settlement charge of $235
million.
The following table summarizes our access lines, high-speed Internet subscribers, Prism TV subscribers,
data centers and number of employees:
As of December 31,
2015 2014 2013
(in thousands except for data
centers, which are actuals)
Operational metrics:
Total access lines(1) .................................. 11,748 12,394 13,002
Total high-speed Internet subscribers(1) .................. 6,048 6,082 5,991
Total Prism TV subscribers ........................... 285 242 175
Total data centers(2) ................................. 59 58 55
Total employees .................................... 43 45 47
(1) Access lines are lines reaching from the customers’ premises to a connection with the public network and
high-speed Internet subscribers are customers that purchase high-speed Internet connection service through
their existing telephone lines, stand-alone telephone lines, or fiber-optic cables. Our methodology for
counting our access lines and high-speed Internet subscribers includes only those lines that we use to
provide services to external customers and excludes lines used solely by us and our affiliates. It also
excludes unbundled loops and includes stand-alone high-speed Internet subscribers. We count lines when
we install the service.
B-6