CenturyLink 2015 Annual Report Download - page 170
Download and view the complete annual report
Please find page 170 of the 2015 CenturyLink annual report below. You can navigate through the pages in the report by either clicking on the pages listed below, or by using the keyword search tool below to find specific information within the annual report.-
 1
1 -
2
-
3
-
4
-
5
-
6
-
7
-
8
-
9
-
10
-
11
-
12
-
13
-
14
-
15
-
16
-
17
-
18
-
19
-
20
-
21
-
22
-
23
-
24
-
25
-
26
-
27
-
28
-
29
-
30
-
31
-
32
-
33
-
34
-
35
-
36
-
37
-
38
-
39
-
40
-
41
-
42
-
43
-
44
-
45
-
46
-
47
-
48
-
49
-
50
-
51
-
52
-
53
-
54
-
55
-
56
-
57
-
58
-
59
-
60
-
61
-
62
-
63
-
64
-
65
-
66
-
67
-
68
-
69
-
70
-
71
-
72
-
73
-
74
-
75
-
76
-
77
-
78
-
79
-
80
-
81
-
82
-
83
-
84
-
85
-
86
-
87
-
88
-
89
-
90
-
91
-
92
-
93
-
94
-
95
-
96
-
97
-
98
-
99
-
100
-
101
-
102
-
103
-
104
-
105
-
106
-
107
-
108
-
109
-
110
-
111
-
112
-
113
-
114
-
115
-
116
-
117
-
118
-
119
-
120
-
121
-
122
-
123
-
124
-
125
-
126
-
127
-
128
-
129
-
130
-
131
-
132
-
133
-
134
-
135
-
136
-
137
-
138
-
139
-
140
-
141
-
142
-
143
-
144
-
145
-
146
-
147
-
148
-
149
-
150
-
151
-
152
-
153
-
154
-
155
-
156
-
157
-
158
-
159
-
 160
160 -
 161
161 -
 162
162 -
 163
163 -
 164
164 -
 165
165 -
 166
166 -
 167
167 -
 168
168 -
 169
169 -
 170
170 -
 171
171 -
 172
172 -
 173
173 -
 174
174 -
 175
175 -
 176
176 -
 177
177 -
 178
178 -
 179
179 -
 180
180 -
181
-
182
-
183
-
184
-
185
-
186
-
187
-
188
-
189
-
190
-
191
-
192
-
193
-
194
-
195
-
196
-
197
-
198
-
199
-
200
-
201
-
202
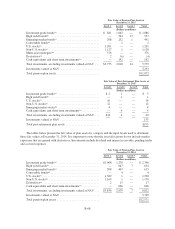
 |
 |

contributions and direct subsidies) that were not payable by the trusts. We estimate that in 2016, we will pay
approximately $137 million of benefits (net of participant contributions and direct subsidies) that are not payable
by the trusts.
We expect our health care cost trend rate to decrease between 0.05% to 0.10% per year from 5.00% in 2016
to an ultimate rate of 4.50% in 2025. Our post-retirement benefit expense, for certain eligible legacy Qwest
retirees and certain eligible legacy CenturyLink retirees, is capped at a set dollar amount. Therefore, those health
care benefit obligations are not subject to increasing health care trends after the effective date of the caps.
A change of 100 basis points in the assumed initial health care cost trend rate would have had the following
effects in 2015:
100 Basis
Points Change
Increase (Decrease)
(Dollars in millions)
Effect on the aggregate of the service and interest cost components of net periodic
post-retirement benefit expense (consolidated statement of operations) ........ $ 3 (3)
Effect on benefit obligation (consolidated balance sheet) ..................... 73 (68)
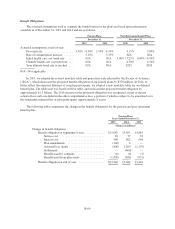
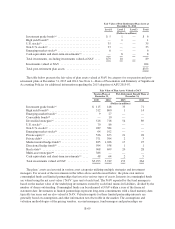
Expected Cash Flows
The qualified pension, non-qualified pension and post-retirement health care benefit payments and
premiums and life insurance premium payments are paid by us or distributed from plan assets. The estimated
benefit payments provided below are based on actuarial assumptions using the demographics of the employee
and retiree populations and have been reduced by estimated participant contributions.
Pension
Plans
Post-Retirement
Benefit Plans
Medicare
Part D
Subsidy
Receipts
(Dollars in millions)
Estimated future benefit payments:
2016 ....................................... $1,059 309 (7)
2017 ....................................... 1,010 300 (7)
2018 ....................................... 991 290 (7)
2019 ....................................... 973 283 (7)
2020 ....................................... 954 276 (7)
2021—2025 ................................. 4,433 1,256 (30)
B-62