CenturyLink 2015 Annual Report Download - page 193
Download and view the complete annual report
Please find page 193 of the 2015 CenturyLink annual report below. You can navigate through the pages in the report by either clicking on the pages listed below, or by using the keyword search tool below to find specific information within the annual report.-
 1
1 -
2
-
3
-
4
-
5
-
6
-
7
-
8
-
9
-
10
-
11
-
12
-
13
-
14
-
15
-
16
-
17
-
18
-
19
-
20
-
21
-
22
-
23
-
24
-
25
-
26
-
27
-
28
-
29
-
30
-
31
-
32
-
33
-
34
-
35
-
36
-
37
-
38
-
39
-
40
-
41
-
42
-
43
-
44
-
45
-
46
-
47
-
48
-
49
-
50
-
51
-
52
-
53
-
54
-
55
-
56
-
57
-
58
-
59
-
60
-
61
-
62
-
63
-
64
-
65
-
66
-
67
-
68
-
69
-
70
-
71
-
72
-
73
-
74
-
75
-
76
-
77
-
78
-
79
-
80
-
81
-
82
-
83
-
84
-
85
-
86
-
87
-
88
-
89
-
90
-
91
-
92
-
93
-
94
-
95
-
96
-
97
-
98
-
99
-
100
-
101
-
102
-
103
-
104
-
105
-
106
-
107
-
108
-
109
-
110
-
111
-
112
-
113
-
114
-
115
-
116
-
117
-
118
-
119
-
120
-
121
-
122
-
123
-
124
-
125
-
126
-
127
-
128
-
129
-
130
-
131
-
132
-
133
-
134
-
135
-
136
-
137
-
138
-
139
-
140
-
141
-
142
-
143
-
144
-
145
-
146
-
147
-
148
-
149
-
150
-
151
-
152
-
153
-
154
-
155
-
156
-
157
-
158
-
159
-
160
-
161
-
162
-
163
-
164
-
165
-
166
-
167
-
168
-
169
-
170
-
171
-
172
-
173
-
174
-
175
-
176
-
177
-
178
-
179
-
180
-
181
-
182
-
 183
183 -
 184
184 -
 185
185 -
 186
186 -
 187
187 -
 188
188 -
 189
189 -
 190
190 -
 191
191 -
 192
192 -
 193
193 -
 194
194 -
 195
195 -
 196
196 -
 197
197 -
 198
198 -
 199
199 -
 200
200 -
 201
201 -
 202
202
 |
 |

We recognize revenues in our consolidated statements of operations for certain USF surcharges and
transaction taxes that we bill to our customers. Our consolidated statements of operations also reflect the related
expense for the amounts we remit to the government agencies. The total amount of such surcharges that we
included in revenues aggregated approximately $544 million, $526 million and $489 million for the years ended
December 31, 2015, 2014 and 2013, respectively. Those USF surcharges, where we record revenue, are included
in “other” operating revenues and transaction tax surcharges are included in “legacy services” revenues. We also
act as a collection agent for certain other USF and transaction taxes that we are required by government agencies
to include in our bills to customers, for which we do not record any revenue or expense because we only act as a
pass-through agent.
Allocations of Revenues and Expenses
Our segment revenues include all revenues from our strategic, legacy and data integration operations as
described in more detail above. Segment revenues are based upon each customer’s classification to an individual
segment. We report our segment revenues based upon all services provided to that segment’s customers. Our
segment expenses for our two segments include specific expenses incurred as a direct result of providing services
and products to segment customers, along with selling, general and administrative expenses that are directly
associated with specific segment customers or activities; and allocated expenses which include network
expenses, facilities expenses and other expenses such as fleet and real estate expenses. We do not assign
depreciation and amortization expense or impairments to our segments, as the related assets and capital
expenditures are centrally managed and are not monitored by or reported to the chief operating decision maker
(“CODM”) by segment. Generally speaking, severance expenses, restructuring expenses and certain centrally
managed administrative functions (such as finance, information technology, legal and human resources) are not
assigned to our segments. Interest expense is also excluded from segment results because we manage our
financing on a total company basis and have not allocated assets or debt to specific segments. Other income, net
is not monitored as a part of our segment operations and is therefore excluded from our segment results.
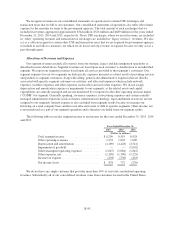
The following table reconciles segment income to net income for the years ended December 31, 2015, 2014
and 2013:
Years Ended December 31,
2015 2014 2013
(Dollars in millions)
Total segment income ....................... $8,209 8,519 8,928
Other operating revenues ..................... 1,232 1,003 1,000
Depreciation and amortization ................. (4,189) (4,428) (4,541)
Impairment of goodwill ...................... — — (1,092)
Other unassigned operating expenses ........... (2,647) (2,684) (2,842)
Other expenses, net ......................... (1,289) (1,300) (1,229)
Income tax expense ......................... (438) (338) (463)
Net income (loss) ........................... $ 878 772 (239)
We do not have any single customer that provides more than 10% of our total consolidated operating
revenues. Substantially all of our consolidated revenues come from customers located in the United States.
B-85