CenturyLink 2015 Annual Report Download - page 185
Download and view the complete annual report
Please find page 185 of the 2015 CenturyLink annual report below. You can navigate through the pages in the report by either clicking on the pages listed below, or by using the keyword search tool below to find specific information within the annual report.-
 1
1 -
2
-
3
-
4
-
5
-
6
-
7
-
8
-
9
-
10
-
11
-
12
-
13
-
14
-
15
-
16
-
17
-
18
-
19
-
20
-
21
-
22
-
23
-
24
-
25
-
26
-
27
-
28
-
29
-
30
-
31
-
32
-
33
-
34
-
35
-
36
-
37
-
38
-
39
-
40
-
41
-
42
-
43
-
44
-
45
-
46
-
47
-
48
-
49
-
50
-
51
-
52
-
53
-
54
-
55
-
56
-
57
-
58
-
59
-
60
-
61
-
62
-
63
-
64
-
65
-
66
-
67
-
68
-
69
-
70
-
71
-
72
-
73
-
74
-
75
-
76
-
77
-
78
-
79
-
80
-
81
-
82
-
83
-
84
-
85
-
86
-
87
-
88
-
89
-
90
-
91
-
92
-
93
-
94
-
95
-
96
-
97
-
98
-
99
-
100
-
101
-
102
-
103
-
104
-
105
-
106
-
107
-
108
-
109
-
110
-
111
-
112
-
113
-
114
-
115
-
116
-
117
-
118
-
119
-
120
-
121
-
122
-
123
-
124
-
125
-
126
-
127
-
128
-
129
-
130
-
131
-
132
-
133
-
134
-
135
-
136
-
137
-
138
-
139
-
140
-
141
-
142
-
143
-
144
-
145
-
146
-
147
-
148
-
149
-
150
-
151
-
152
-
153
-
154
-
155
-
156
-
157
-
158
-
159
-
160
-
161
-
162
-
163
-
164
-
165
-
166
-
167
-
168
-
169
-
170
-
171
-
172
-
173
-
174
-
 175
175 -
 176
176 -
 177
177 -
 178
178 -
 179
179 -
 180
180 -
 181
181 -
 182
182 -
 183
183 -
 184
184 -
 185
185 -
 186
186 -
 187
187 -
 188
188 -
 189
189 -
 190
190 -
 191
191 -
 192
192 -
 193
193 -
 194
194 -
 195
195 -
196
-
197
-
198
-
199
-
200
-
201
-
202
 |
 |

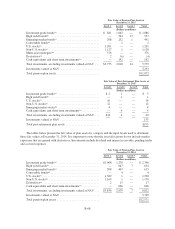
the consolidated statements of operations for our share-based payment arrangements for the years ended
December 31, 2015, 2014 and 2013, was $28 million, $29 million and $25 million, respectively. At
December 31, 2015, there was $113 million of total unrecognized compensation expense related to our share-
based payment arrangements, which we expect to recognize over a weighted-average period of 2.5 years.
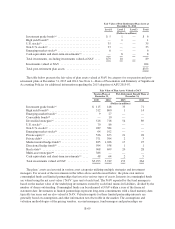
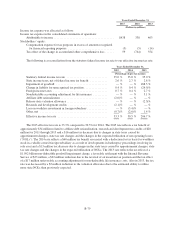
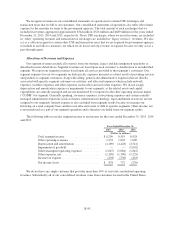
(9) Earnings (Loss) Per Common Share
Basic and diluted earnings (loss) per common share for the years ended December 31, 2015, 2014 and 2013
were calculated as follows:
Years Ended December 31,
2015 2014 2013
(Dollars in millions, except per share
amounts, shares in thousands)
Income (Loss) (Numerator):
Net income (loss) .................................................. $ 878 772 (239)
Earnings applicable to non-vested restricted stock ........................ — — —
Net income (loss) applicable to common stock for computing basic earnings
(loss) per common share .......................................... 878 772 (239)
Net income (loss) as adjusted for purposes of computing diluted earnings (loss)
per common share ............................................... $ 878 772 (239)
Shares (Denominator):
Weighted average number of shares:
Outstanding during period ....................................... 559,260 572,748 604,404
Non-vested restricted stock ...................................... (4,982) (4,313) (3,512)
Weighted average shares outstanding for computing basic earnings (loss) per
common share .................................................. 554,278 568,435 600,892
Incremental common shares attributable to dilutive securities:
Shares issuable under convertible securities ............................. 10 10 —
Shares issuable under incentive compensation plans ...................... 805 1,294 —
Number of shares as adjusted for purposes of computing diluted earnings (loss)
per common share ............................................... 555,093 569,739 600,892
Basic earnings (loss) per common share ................................ $ 1.58 1.36 (0.40)
Diluted earnings (loss) per common share ............................... $ 1.58 1.36 (0.40)
Our calculation of diluted earnings (loss) per common share excludes shares of common stock that are
issuable upon exercise of stock options when the exercise price is greater than the average market price of our
common stock. We also exclude unvested restricted stock awards that are antidilutive as a result of unrecognized
compensation cost. Such shares averaged 3.1 million, 2.5 million and 2.7 million for 2015, 2014 and 2013,
respectively. For the year ended December 31, 2013, due to the net loss position, we excluded from the
calculation of diluted loss per share 1.3 million shares which were potentially issuable under incentive
compensation plans or convertible securities, as their effect, if included, would have been anti-dilutive.
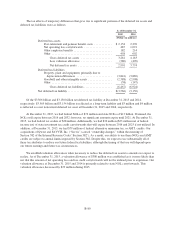
(10) Fair Value Disclosure
Our financial instruments consist of cash and cash equivalents, accounts receivable, accounts payable and
long-term debt, excluding capital lease obligations. Due to their short-term nature, the carrying amounts of our
cash and cash equivalents, accounts receivable and accounts payable approximate their fair values.
B-77