CenturyLink 2015 Annual Report Download - page 118
Download and view the complete annual report
Please find page 118 of the 2015 CenturyLink annual report below. You can navigate through the pages in the report by either clicking on the pages listed below, or by using the keyword search tool below to find specific information within the annual report.-
 1
1 -
2
-
3
-
4
-
5
-
6
-
7
-
8
-
9
-
10
-
11
-
12
-
13
-
14
-
15
-
16
-
17
-
18
-
19
-
20
-
21
-
22
-
23
-
24
-
25
-
26
-
27
-
28
-
29
-
30
-
31
-
32
-
33
-
34
-
35
-
36
-
37
-
38
-
39
-
40
-
41
-
42
-
43
-
44
-
45
-
46
-
47
-
48
-
49
-
50
-
51
-
52
-
53
-
54
-
55
-
56
-
57
-
58
-
59
-
60
-
61
-
62
-
63
-
64
-
65
-
66
-
67
-
68
-
69
-
70
-
71
-
72
-
73
-
74
-
75
-
76
-
77
-
78
-
79
-
80
-
81
-
82
-
83
-
84
-
85
-
86
-
87
-
88
-
89
-
90
-
91
-
92
-
93
-
94
-
95
-
96
-
97
-
98
-
99
-
100
-
101
-
102
-
103
-
104
-
105
-
106
-
107
-
 108
108 -
 109
109 -
 110
110 -
 111
111 -
 112
112 -
 113
113 -
 114
114 -
 115
115 -
 116
116 -
 117
117 -
 118
118 -
 119
119 -
 120
120 -
 121
121 -
 122
122 -
 123
123 -
 124
124 -
 125
125 -
 126
126 -
 127
127 -
 128
128 -
129
-
130
-
131
-
132
-
133
-
134
-
135
-
136
-
137
-
138
-
139
-
140
-
141
-
142
-
143
-
144
-
145
-
146
-
147
-
148
-
149
-
150
-
151
-
152
-
153
-
154
-
155
-
156
-
157
-
158
-
159
-
160
-
161
-
162
-
163
-
164
-
165
-
166
-
167
-
168
-
169
-
170
-
171
-
172
-
173
-
174
-
175
-
176
-
177
-
178
-
179
-
180
-
181
-
182
-
183
-
184
-
185
-
186
-
187
-
188
-
189
-
190
-
191
-
192
-
193
-
194
-
195
-
196
-
197
-
198
-
199
-
200
-
201
-
202
 |
 |

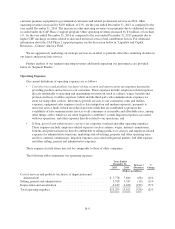
Years Ended
December 31, Increase /
(Decrease)
%
Change2014 2013
(Dollars in millions)
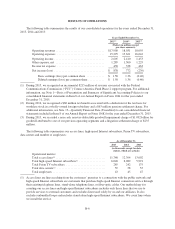
Cost of services and products (exclusive of depreciation and
amortization) ............................................. $ 7,846 7,507 339 5 %
Selling, general and administrative .............................. 3,347 3,502 (155) (4)%
Depreciation and amortization .................................. 4,428 4,541 (113) (2)%
Impairment of goodwill ....................................... — 1,092 (1,092) nm
Total operating expenses ...................................... $15,621 16,642 (1,021) (6)%
nm—Attributing changes in impairment of goodwill to the 2013 goodwill impairment charge are considered not
meaningful.
Cost of Services and Products (exclusive of depreciation and amortization)
Cost of services and products (exclusive of depreciation and amortization) decreased by $68 million, or 1%,
for the year ended December 31, 2015 as compared to the year ended December 31, 2014. Excluding the lower
customer premises equipment costs, cost of services and products increased by $56 million for the year ended
December 31, 2015 as compared to the year ended December 31, 2014. The increase in costs of services and
products was primarily due to increases in pension and postretirement costs, USF rate increases, higher network
expenses and increases in content costs for Prism TV. These increases were partially offset by decreases in
salaries and wages from lower headcount, professional fees and contract labor costs. Cost of services and
products (exclusive of depreciation and amortization) increased by $339 million, or 5%, for the year ended
December 31, 2014 as compared to the year ended December 31, 2013 primarily due to increases in employee-
related costs (which was significantly impacted by the below-noted lump sum pension payments), customer
premises equipment installation expenses related to the increase in data integration revenues, facility and network
costs, real estate and power costs and content costs for Prism TV.
Selling, General and Administrative
Selling, general and administrative expenses decreased by $19 million, or less than 1%, for the year ended
December 31, 2015 as compared to the year ended December 31, 2014. The decrease in selling, general and
administrative expenses was primarily due to lower benefit expenses, insurance costs and asset impairment
charges. These decreases were partially offset by increases in bad debt expense, external commissions and
regulatory fines of $15 million associated with a 911 system outage. Selling, general and administrative expenses
decreased by $155 million, or 4%, for the year ended December 31, 2014 as compared to the year ended
December 31, 2013 primarily due to a charge in 2013 of $235 million in connection with a litigation settlement.
The decrease was partially offset by increases in employee-related costs (including severance costs), insurance
costs and impairment charges related to office buildings sold and currently being held for sale.
Pension Lump Sum Offer
Our pension plan contains provisions that allow us, from time to time, to offer lump sum payment options to
certain former employees in settlement of their future retirement benefits. We record an accounting settlement
charge associated with these lump sum payments only if, in the aggregate, they exceed the sum of the annual
service and interest costs for the plan’s net periodic pension benefit cost, which represents the settlement
threshold. In September 2015, we offered to make cash settlement payments in December 2015 to a group of
former employees provided they accepted the offer by the end of October 2015. During the fourth quarter of
2015, we made cash settlement payments for the lump sum offer of approximately $356 million. The total
amount of the lump sum settlement payments for the year ended December 31, 2015, which included the lump
sum offer and lump sum elections from employees who terminated employment during the year, was less than
B-10