CenturyLink 2015 Annual Report Download - page 177
Download and view the complete annual report
Please find page 177 of the 2015 CenturyLink annual report below. You can navigate through the pages in the report by either clicking on the pages listed below, or by using the keyword search tool below to find specific information within the annual report.-
 1
1 -
2
-
3
-
4
-
5
-
6
-
7
-
8
-
9
-
10
-
11
-
12
-
13
-
14
-
15
-
16
-
17
-
18
-
19
-
20
-
21
-
22
-
23
-
24
-
25
-
26
-
27
-
28
-
29
-
30
-
31
-
32
-
33
-
34
-
35
-
36
-
37
-
38
-
39
-
40
-
41
-
42
-
43
-
44
-
45
-
46
-
47
-
48
-
49
-
50
-
51
-
52
-
53
-
54
-
55
-
56
-
57
-
58
-
59
-
60
-
61
-
62
-
63
-
64
-
65
-
66
-
67
-
68
-
69
-
70
-
71
-
72
-
73
-
74
-
75
-
76
-
77
-
78
-
79
-
80
-
81
-
82
-
83
-
84
-
85
-
86
-
87
-
88
-
89
-
90
-
91
-
92
-
93
-
94
-
95
-
96
-
97
-
98
-
99
-
100
-
101
-
102
-
103
-
104
-
105
-
106
-
107
-
108
-
109
-
110
-
111
-
112
-
113
-
114
-
115
-
116
-
117
-
118
-
119
-
120
-
121
-
122
-
123
-
124
-
125
-
126
-
127
-
128
-
129
-
130
-
131
-
132
-
133
-
134
-
135
-
136
-
137
-
138
-
139
-
140
-
141
-
142
-
143
-
144
-
145
-
146
-
147
-
148
-
149
-
150
-
151
-
152
-
153
-
154
-
155
-
156
-
157
-
158
-
159
-
160
-
161
-
162
-
163
-
164
-
165
-
166
-
 167
167 -
 168
168 -
 169
169 -
 170
170 -
 171
171 -
 172
172 -
 173
173 -
 174
174 -
 175
175 -
 176
176 -
 177
177 -
 178
178 -
 179
179 -
 180
180 -
 181
181 -
 182
182 -
 183
183 -
 184
184 -
 185
185 -
 186
186 -
 187
187 -
188
-
189
-
190
-
191
-
192
-
193
-
194
-
195
-
196
-
197
-
198
-
199
-
200
-
201
-
202
 |
 |

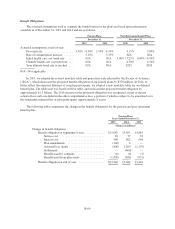
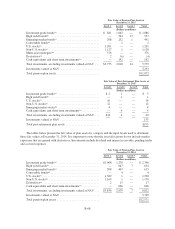
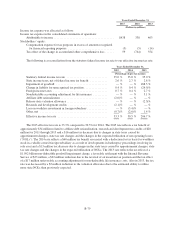
Fair Value of Post-Retirement Plan Assets at
December 31, 2014
Level 1 Level 2 Level 3 Total
(Dollars in millions)
Investment grade bonds(a) ............................. $ 5 1 — $ 6
High yield bonds(b) .................................. — 1 — 1
U.S. stocks(f) ....................................... 35 — — 35
Non-U.S. stocks(g) ................................... 33 — — 33
Emerging market stocks(h) ............................. 6 — — 6
Cash equivalents and short-term investments(o) ............ — 8 — 8
Total investments, excluding investments valued at NAV .... $79 10 — 89
Investments valued at NAV ........................... 264
Total post-retirement plan assets ....................... $353
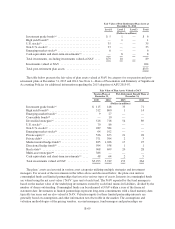
The table below presents the fair value of plan assets valued at NAV by category for our pension and post-
retirement plans at December 31, 2015 and 2014. See Note 1—Basis of Presentation and Summary of Significant
Accounting Policies for additional information regarding the 2015 adoption of ASU 2015-07.
Fair Value of Plan Assets Valued at NAV
Pension Plans at
December 31,
Post-Retirement Benefit Plans at
December 31,
2015 2014 2015 2014
(Dollars in millions)
Investment grade bonds(a) $ 115 148 35 71
High yield bonds(b) .......................... 512 860 1 14
Emerging market bonds(c) ..................... 9 27 — —
Convertible bonds(d) ......................... — 10 — —
Diversified strategies(e) ....................... 516 718 54 89
U.S. stocks(f) ............................... 70 86 — —
Non-U.S. stocks(g) ........................... 289 384 — —
Emerging market stocks(h) .................... 64 102 — —
Private equity(i) ............................. 526 673 21 28
Private debt(j) ............................... 371 394 2 3
Market neutral hedge funds(k) .................. 825 1,026 17 25
Directional hedge funds(k) ..................... 594 558 1 1
Real estate(l) ............................... 968 699 20 28
Multi-asset strategies(m) ...................... 386 — — —
Cash equivalents and short-term investments(o) .... 48 64 2 5
Total investments valued at NAV .............. $5,293 5,749 153 264
The plans’ assets are invested in various asset categories utilizing multiple strategies and investment
managers. For several of the investments in the tables above and discussed below, the plans own units in
commingled funds and limited partnerships that invest in various types of assets. Interests in commingled funds
are valued using the net asset value (“NAV”) per unit of each fund. The NAV reported by the fund manager is
based on the market value of the underlying investments owned by each fund, minus its liabilities, divided by the
number of shares outstanding. Commingled funds can be redeemed at NAV within a year of the financial
statement date. Investments in limited partnerships represent long-term commitments with a fixed maturity date,
typically ten years and are also valued at NAV. Valuation inputs for these limited partnership interests are
generally based on assumptions and other information not observable in the market. The assumptions and
valuation methodologies of the pricing vendors, account managers, fund managers and partnerships are
B-69