CenturyLink 2015 Annual Report Download - page 136
Download and view the complete annual report
Please find page 136 of the 2015 CenturyLink annual report below. You can navigate through the pages in the report by either clicking on the pages listed below, or by using the keyword search tool below to find specific information within the annual report.-
 1
1 -
2
-
3
-
4
-
5
-
6
-
7
-
8
-
9
-
10
-
11
-
12
-
13
-
14
-
15
-
16
-
17
-
18
-
19
-
20
-
21
-
22
-
23
-
24
-
25
-
26
-
27
-
28
-
29
-
30
-
31
-
32
-
33
-
34
-
35
-
36
-
37
-
38
-
39
-
40
-
41
-
42
-
43
-
44
-
45
-
46
-
47
-
48
-
49
-
50
-
51
-
52
-
53
-
54
-
55
-
56
-
57
-
58
-
59
-
60
-
61
-
62
-
63
-
64
-
65
-
66
-
67
-
68
-
69
-
70
-
71
-
72
-
73
-
74
-
75
-
76
-
77
-
78
-
79
-
80
-
81
-
82
-
83
-
84
-
85
-
86
-
87
-
88
-
89
-
90
-
91
-
92
-
93
-
94
-
95
-
96
-
97
-
98
-
99
-
100
-
101
-
102
-
103
-
104
-
105
-
106
-
107
-
108
-
109
-
110
-
111
-
112
-
113
-
114
-
115
-
116
-
117
-
118
-
119
-
120
-
121
-
122
-
123
-
124
-
125
-
 126
126 -
 127
127 -
 128
128 -
 129
129 -
 130
130 -
 131
131 -
 132
132 -
 133
133 -
 134
134 -
 135
135 -
 136
136 -
 137
137 -
 138
138 -
 139
139 -
 140
140 -
 141
141 -
 142
142 -
 143
143 -
 144
144 -
 145
145 -
 146
146 -
147
-
148
-
149
-
150
-
151
-
152
-
153
-
154
-
155
-
156
-
157
-
158
-
159
-
160
-
161
-
162
-
163
-
164
-
165
-
166
-
167
-
168
-
169
-
170
-
171
-
172
-
173
-
174
-
175
-
176
-
177
-
178
-
179
-
180
-
181
-
182
-
183
-
184
-
185
-
186
-
187
-
188
-
189
-
190
-
191
-
192
-
193
-
194
-
195
-
196
-
197
-
198
-
199
-
200
-
201
-
202
 |
 |

Capital Expenditures
We incur capital expenditures on an ongoing basis in order to enhance and modernize our networks,
compete effectively in our markets and expand our service offerings. We evaluate capital expenditure projects
based on a variety of factors, including expected strategic impacts (such as forecasted impact on revenue growth,
productivity, expenses, service levels and customer retention) and our expected return on investment. The
amount of capital investment is influenced by, among other things, demand for our services and products, cash
flow generated by operating activities, cash required for other purposes and regulatory considerations (such as
the CAF Phase 2 infrastructure buildout requirements). Based on current circumstances, we estimate that our
total capital expenditures for 2016 will be approximately $3.0 billion, inclusive of CAF Phase 2 related capital
expenditures.
Our capital expenditures continue to be focused on our strategic services. For more information on capital
spending, see Items 1 and 1A of our Annual Report on Form 10-K for the year ended December 31, 2015.
Debt and Other Financing Arrangements
Subject to market conditions, we expect to continue to issue debt securities from time to time in the future to
refinance a substantial portion of our maturing debt, including issuing Qwest Corporation debt securities to
refinance its maturing debt to the extent feasible. The availability, interest rate and other terms of any new
borrowings will depend on the ratings assigned to us and Qwest Corporation by credit rating agencies, among
other factors. For further information on our debt maturities, see below “Future Contractual Obligations.”
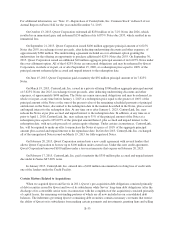
As of the date of our Annual Report on Form 10-K for the year ended December 31, 2015, the credit ratings
for the senior unsecured debt of CenturyLink, Inc. and Qwest Corporation were as follows:
Agency CenturyLink, Inc. Qwest Corporation
Standard & Poor’s .................... BB BBB-
Moody’s Investors Service, Inc. ......... Ba2 Baa3
Fitch Ratings ........................ BB+ BBB-
Our credit ratings are reviewed and adjusted from time to time by the rating agencies, and downgrades of
CenturyLink, Inc.’s senior unsecured debt ratings could, under certain circumstances, incrementally increase the
cost of our borrowing under the Credit Facility. Moreover, any downgrades of CenturyLink, Inc.’s or Qwest
Corporation’s senior unsecured debt ratings could impact our access to debt capital or further raise our borrowing
costs. See “Risk Factors—Risks Affecting our Liquidity and Capital Resources” in Item 1A of our Annual
Report on Form 10-K for the year ended December 31, 2015.
In January 2016, Qwest Corporation issued $235 million aggregate principal amount of 7% Notes due 2056,
in exchange for net proceeds, after deducting underwriting discounts and other expenses, of approximately
$227 million. All of the 7% Notes are unsecured obligations and may be redeemed by Qwest Corporation, in
whole or in part, on or after February 1, 2021, at a redemption price equal to 100% of the principal amount
redeemed plus accrued and unpaid interest to the redemption date.
Net Operating Loss Carryforwards
We have been using NOLs to offset our federal taxable income. At December 31, 2015, we had
approximately $72 million of federal net operating losses. Since the remainder of our NOLs are subject to the
limitations imposed by section 382 of the Internal Revenue Code, we expect that the amounts of our cash flows
dedicated to the payment of federal taxes will increase substantially. The amounts of those payments will depend
upon many factors, including future earnings, tax law changes and future tax circumstances. Based on current
laws (including the extension of bonus depreciation) and circumstances applied to estimates of 2016 earnings, we
estimate our cash income tax liability related to 2016 will be between $400 million to $600 million.
B-28