CenturyLink 2015 Annual Report Download - page 120
Download and view the complete annual report
Please find page 120 of the 2015 CenturyLink annual report below. You can navigate through the pages in the report by either clicking on the pages listed below, or by using the keyword search tool below to find specific information within the annual report.-
 1
1 -
2
-
3
-
4
-
5
-
6
-
7
-
8
-
9
-
10
-
11
-
12
-
13
-
14
-
15
-
16
-
17
-
18
-
19
-
20
-
21
-
22
-
23
-
24
-
25
-
26
-
27
-
28
-
29
-
30
-
31
-
32
-
33
-
34
-
35
-
36
-
37
-
38
-
39
-
40
-
41
-
42
-
43
-
44
-
45
-
46
-
47
-
48
-
49
-
50
-
51
-
52
-
53
-
54
-
55
-
56
-
57
-
58
-
59
-
60
-
61
-
62
-
63
-
64
-
65
-
66
-
67
-
68
-
69
-
70
-
71
-
72
-
73
-
74
-
75
-
76
-
77
-
78
-
79
-
80
-
81
-
82
-
83
-
84
-
85
-
86
-
87
-
88
-
89
-
90
-
91
-
92
-
93
-
94
-
95
-
96
-
97
-
98
-
99
-
100
-
101
-
102
-
103
-
104
-
105
-
106
-
107
-
108
-
109
-
 110
110 -
 111
111 -
 112
112 -
 113
113 -
 114
114 -
 115
115 -
 116
116 -
 117
117 -
 118
118 -
 119
119 -
 120
120 -
 121
121 -
 122
122 -
 123
123 -
 124
124 -
 125
125 -
 126
126 -
 127
127 -
 128
128 -
 129
129 -
 130
130 -
131
-
132
-
133
-
134
-
135
-
136
-
137
-
138
-
139
-
140
-
141
-
142
-
143
-
144
-
145
-
146
-
147
-
148
-
149
-
150
-
151
-
152
-
153
-
154
-
155
-
156
-
157
-
158
-
159
-
160
-
161
-
162
-
163
-
164
-
165
-
166
-
167
-
168
-
169
-
170
-
171
-
172
-
173
-
174
-
175
-
176
-
177
-
178
-
179
-
180
-
181
-
182
-
183
-
184
-
185
-
186
-
187
-
188
-
189
-
190
-
191
-
192
-
193
-
194
-
195
-
196
-
197
-
198
-
199
-
200
-
201
-
202
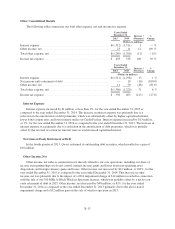
 |
 |

Years Ended
December 31, Increase /
(Decrease)
%
Change2014 2013
(Dollars in millions)
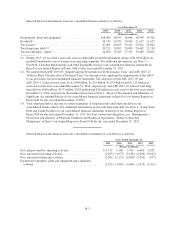
Depreciation .................................................. $2,958 2,952 6 — %
Amortization .................................................. 1,470 1,589 (119) (7)%
Total depreciation and amortization ................................ $4,428 4,541 (113) (2)%
Annual depreciation expense is impacted by several factors, including changes in our depreciable cost basis,
changes in our estimates of the remaining economic life of certain network assets and the addition of new plant.
Depreciation expense decreased by $122 million, or 4%, for the year ended December 31, 2015 as compared to
the year ended December 31, 2014. The depreciation expense related to our plant for the year ended
December 31, 2015 was lower than the depreciation expense for the year ended December 31, 2014 due to full
depreciation and retirement of certain plant placed in service prior to 2015. This decrease was partially offset by
increases in depreciation attributable to new plant placed in service during the year ended December 31, 2015
and the impact of changes in the estimated lives of certain property, plant and equipment which resulted in
additional depreciation during 2015. The changes in the estimated lives of certain property, plant and equipment
resulted in an increase in depreciation expense of approximately $48 million for 2015, which was more than fully
offset by the decrease in depreciation expense noted above. Depreciation expense increased by $6 million, or less
than 1%, for the year ended December 31, 2014 as compared to the year ended December 31, 2013. The 2014
depreciation expense was higher than the respective prior period depreciation expense due to new plant additions
in 2014 and changes in the estimated lives of certain property, plant and equipment, which were partially offset
by our plant aging and becoming fully depreciated or retired. During January 2014, we implemented changes in
estimates that reduced the remaining economic lives of certain switch and circuit network equipment, which
resulted in increased 2014 annual depreciation expense. Additionally, we developed a plan to migrate customers
from one of our networks to another between late 2014 and late 2015. As a result, we implemented changes in
estimates that reduced the remaining economic lives of certain network assets. The impact from the above-noted
changes in estimates and network migration resulted in an increase in depreciation expense of approximately $90
million for the year ended December 31, 2014. For more information about the changes in our estimates of the
remaining economic lives of these assets, see Note 1—Basis of Presentation and Summary of Significant
Accounting Policies to our consolidated financial statements in Item 8 of our Annual Report on Form 10-K for
the year ended December 31, 2015.
Amortization expense decreased by $117 million, or 8%, for the year ended December 31, 2015 as
compared to the year ended December 31, 2014 and amortization expense decreased by $119 million, or 7%, for
the year ended December 31, 2014 as compared to the year ended December 31, 2013. The decrease in
amortization expense for both periods was primarily due to software becoming fully amortized faster than new
software was acquired or developed.
Goodwill Impairment
During our 2013 annual goodwill impairment assessment, we concluded the carrying value of goodwill
assigned to one of our previous reporting units exceeded its estimated implied fair value by $1.092 billion. The
decline in estimated fair value of this previous reporting unit was the result of slower than previously projected
revenue and margin growth and greater than anticipated competitive pressures.
For additional information on the risk associated with intangible assets, see “Critical Accounting Policies
and Estimates-Goodwill, Customer Relationships and Other Intangibles Assets” below and “Risk Factors” in
Item 1A of our Annual Report on Form 10-K for the year ended December 31, 2015.
Further analysis of our operating expenses by segment is provided below in “Segment Results.”
B-12