CenturyLink 2015 Annual Report Download - page 190
Download and view the complete annual report
Please find page 190 of the 2015 CenturyLink annual report below. You can navigate through the pages in the report by either clicking on the pages listed below, or by using the keyword search tool below to find specific information within the annual report.-
 1
1 -
2
-
3
-
4
-
5
-
6
-
7
-
8
-
9
-
10
-
11
-
12
-
13
-
14
-
15
-
16
-
17
-
18
-
19
-
20
-
21
-
22
-
23
-
24
-
25
-
26
-
27
-
28
-
29
-
30
-
31
-
32
-
33
-
34
-
35
-
36
-
37
-
38
-
39
-
40
-
41
-
42
-
43
-
44
-
45
-
46
-
47
-
48
-
49
-
50
-
51
-
52
-
53
-
54
-
55
-
56
-
57
-
58
-
59
-
60
-
61
-
62
-
63
-
64
-
65
-
66
-
67
-
68
-
69
-
70
-
71
-
72
-
73
-
74
-
75
-
76
-
77
-
78
-
79
-
80
-
81
-
82
-
83
-
84
-
85
-
86
-
87
-
88
-
89
-
90
-
91
-
92
-
93
-
94
-
95
-
96
-
97
-
98
-
99
-
100
-
101
-
102
-
103
-
104
-
105
-
106
-
107
-
108
-
109
-
110
-
111
-
112
-
113
-
114
-
115
-
116
-
117
-
118
-
119
-
120
-
121
-
122
-
123
-
124
-
125
-
126
-
127
-
128
-
129
-
130
-
131
-
132
-
133
-
134
-
135
-
136
-
137
-
138
-
139
-
140
-
141
-
142
-
143
-
144
-
145
-
146
-
147
-
148
-
149
-
150
-
151
-
152
-
153
-
154
-
155
-
156
-
157
-
158
-
159
-
160
-
161
-
162
-
163
-
164
-
165
-
166
-
167
-
168
-
169
-
170
-
171
-
172
-
173
-
174
-
175
-
176
-
177
-
178
-
179
-
 180
180 -
 181
181 -
 182
182 -
 183
183 -
 184
184 -
 185
185 -
 186
186 -
 187
187 -
 188
188 -
 189
189 -
 190
190 -
 191
191 -
 192
192 -
 193
193 -
 194
194 -
 195
195 -
 196
196 -
 197
197 -
 198
198 -
 199
199 -
 200
200 -
201
-
202
 |
 |

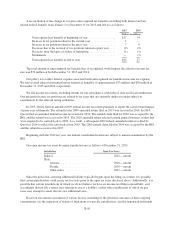
of certain disputed issues, and (iv) the administrative practices of applicable taxing jurisdictions, it is reasonably
possible that the related unrecognized tax benefits for uncertain tax positions previously taken may decrease by
up to $11 million within the next 12 months. The actual amount of such decrease, if any, will depend on several
future developments and events, many of which are outside our control.
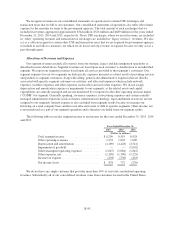
(12) Segment Information
We are organized into operating segments based on customer type, business and consumer. These operating
segments are our two reportable segments in our consolidated financial statements:
•Business Segment. Consists generally of providing strategic, legacy and data integration products and
services to small, medium and enterprise business, wholesale and governmental customers, including
other communication providers. Our strategic products and services offered to these customers include
our MPLS, private line (including special access), Ethernet, high-speed Internet, colocation, managed
hosting, cloud hosting and other ancillary services. Our legacy services offered to these customers
primarily include switched access and local and long-distance voice services, including the sale of
unbundled network elements (“UNEs”) which allow our wholesale customers to use all or part of our
network to provide voice and data services to their customers. Our data integration offerings include
the sale of telecommunications equipment located on customers’ premises and related professional
services. These services include network management, installation and maintenance of data equipment
and the building of proprietary fiber-optic broadband networks; and
•Consumer Segment. Consists generally of providing strategic and legacy products and services to
residential customers. Our strategic products and services offered to these customers include our high-
speed Internet, video (including our Prism TV services) and wireless services. Our legacy services
offered to these customers include local and long-distance voice services.
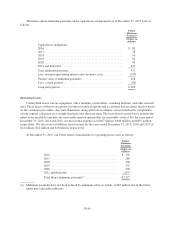
The following table summarizes our segment results for 2015, 2014 and 2013 based on the segment
categorization we were operating under at December 31, 2015.
Years Ended December 31,
2015 2014 2013
(Dollars in millions)
Total segment revenues ..................... $16,668 17,028 17,095
Total segment expenses ..................... 8,459 8,509 8,167
Total segment income ...................... $ 8,209 8,519 8,928
Total margin percentage ..................... 49% 50% 52%
Business segment:
Revenues ............................ $10,647 11,034 11,091
Expenses ............................. 6,034 6,089 5,808
Income .............................. $ 4,613 4,945 5,283
Margin percentage ..................... 43% 45% 48%
Consumer segment:
Revenues ............................ $ 6,021 5,994 6,004
Expenses ............................. 2,425 2,420 2,359
Income .............................. $ 3,596 3,574 3,645
Margin percentage ..................... 60% 60% 61%
B-82